
W. D. GANN FORECASTING
Forecasting the markets is another trademark of the legendary trader W. D. Gann. Many of Gann's annual forecasts from his newsletters ae still in circulation today. Most are remarkably accurate.
Replicating Gann's forecasting method, we are finding that even today 85% of the forecasts play out as predicted. One of Gann's strongest and most accurate forecasts was the RG7 forecast (decoded from the chapter "Robert Gordon's 7 Days" in his novel, 'The Tunnel Thru The Air'). This forecast can vary from 18 month to beyond 2 years, and set an important context for his Annual Forecast included in his 'Supply & Demand' Newsletter. These forecasts displayed on this page, going back about 20 years. All of W. D. Gann's forecasting methods are taught in their entirety in our 'Master The Markets' Training.
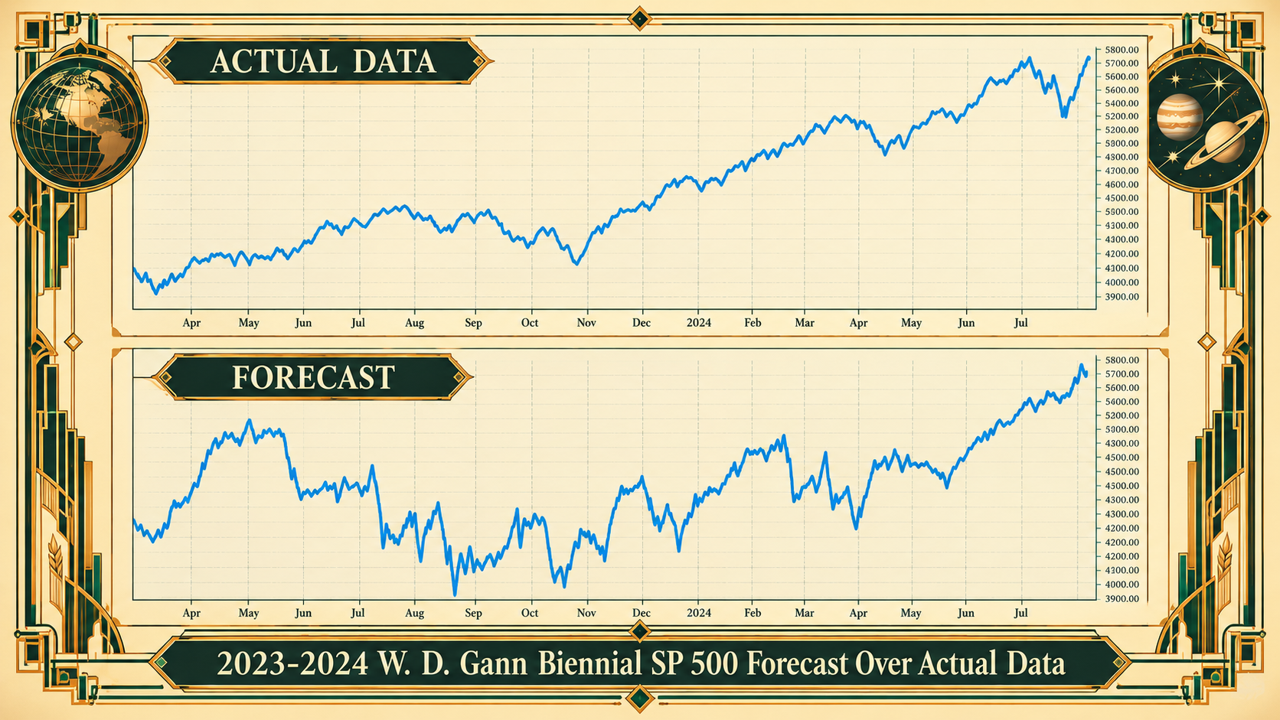
W. D. Gann forecasts are drawn and published before the market data for each period and never changed. Below is a gallery of our W. D. Gann RG7 Forecasts of the SP 500 going back to 2007. As you scroll through the gallery, each plate has the forecast at the bottom and the actual market data played out on top for the entire period. Years covered are labelled above charts. Special notes follow the gallery.
Note that the Gann forecasting techniques described on this page are only one building block of W. D. Gann's trading strategies, instead of a stand-alone trading system. You can see some of W. D. Gann's complete trading strategies here.
Just about all of the forecasts of the SP 500 above were dead on. Except for the COVID period and 2011- 2013, which was a complete inversion. We would label this a failure, but what is interesting is that all the failures are exact opposites like that, with the timing matching.
In the period 2015- 2017, we see the market perfectly acts out the forecast right up until the November 8th, 2016 election of Donald Trump. As W. D. Gann and Luther Jensen laid out in their writings, sudden, unexpected news always interrupts forecasts and cycles. Gann wrote a special chapter on elections unexpectedly altering forecasts in his book, 'The Truth Of The Stock Tape.' I believe that the down forecast from that point is telling you what the future would have been if someone else was elected.
The forecast from 2019-2021 seems accurate right up until COVID. Then it seems hard to discern whether how accurate it is. There is a giant scar on the chart left by COVID and then a hard bounce up.
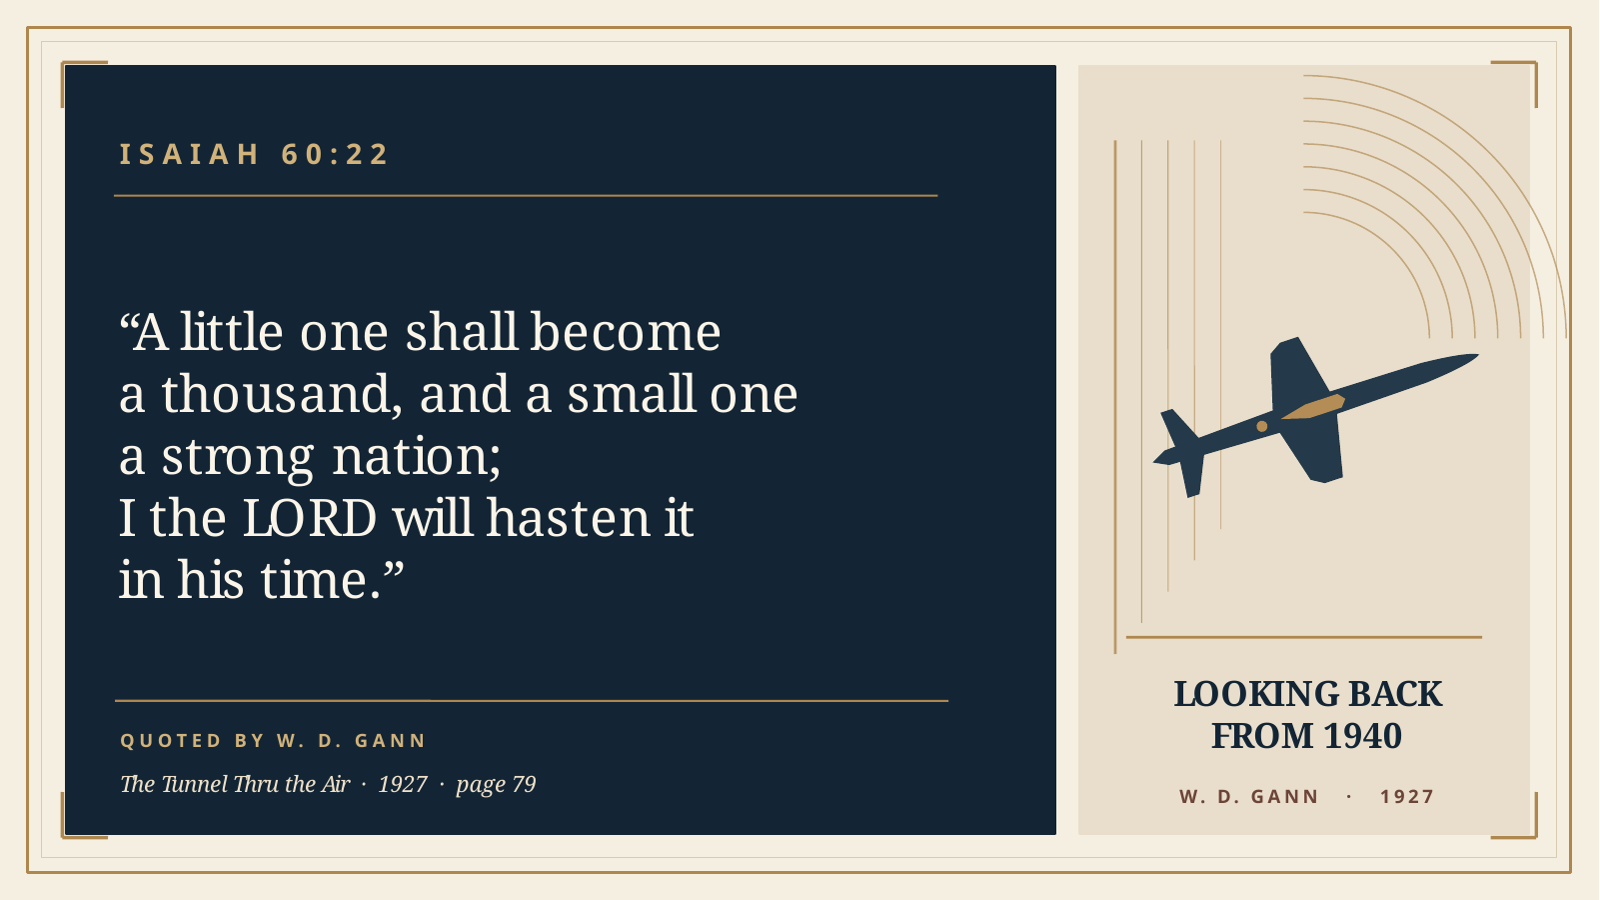
Gann gave us a clue as to how he used repeating cycles as fractals to forecast when he quoted Isaiah 60 in the picture to the right. The Annual Forecasts of W. D. Gann from his 'Supply & Demand Newsletter' are probably most famous. This technique serves as the foundation for our 'Empire Market Forecast Letter.' You can see the last decade of these W. D. Gann Annual Forecasts and get a free copy of the Empire Newsletter here.