W. D. GANN'S PERIODIC CYCLE
An offshoot of W. D. Gann's “Magic Cycle” technique, the periodic cycle gives us a regular, predictable intraday cycle. This cycle shows up best on the $TICK Index. The length of this cycle changes every day, as does its anchor. But we can reliably predict when the cycle starts with a set formula and rules. (SCROLL DOWN FOR PICS.)
The cycle is calculated before the day begins, precisely indicated by the formula. After this cycle starts, each period and alternation remain constant.

We can match this cycle with the trend (both secular and Arcana predictive) and use the alternation as a buying or selling trigger in the same direction. There are times where the TICK diverges against its cyclical direction. When price and $TICK diverge from the Periodic Cycle. In these instances, we are handed unmatched opportunity for market entry. Risk to reward becomes superior, because you can predict the direction and duration of big money institutional buying and selling.
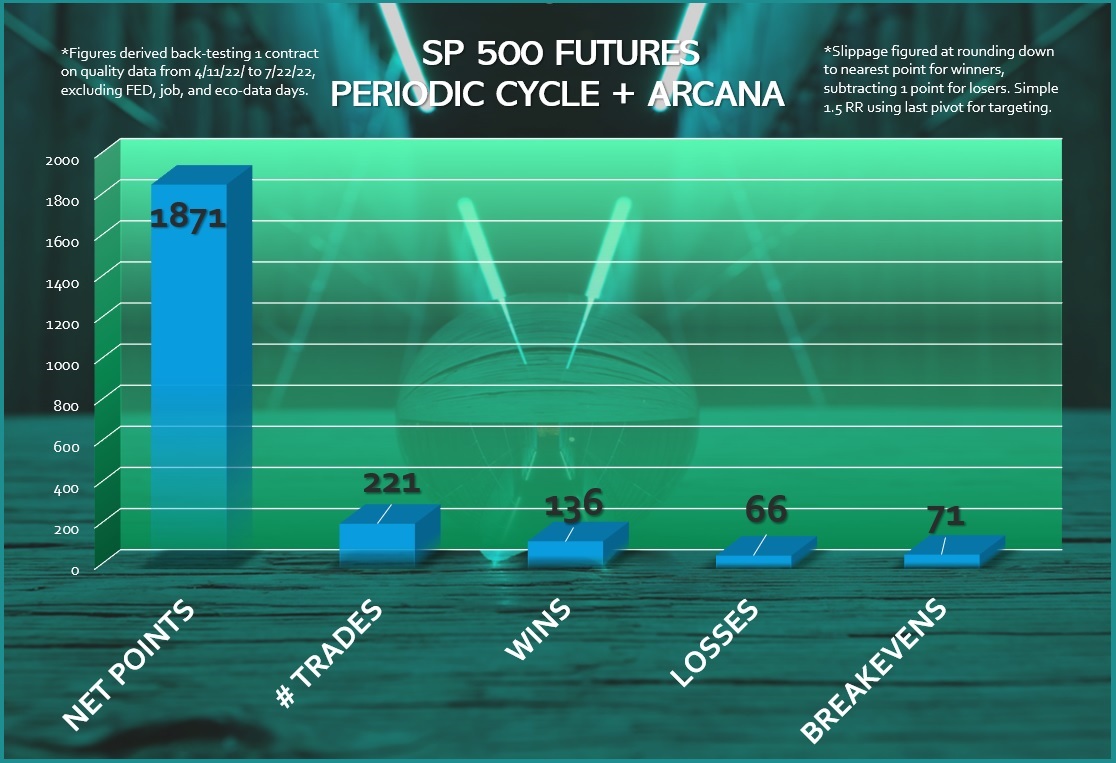
Click on the graph to the right to expand. Combining the Periodic Cycle, Arcana Trend, and the VWAP to agree on trade direction. Then we use 1.5 reward/risk of the last pivot to create a potent trading strategy. This back-testing uses only 1 contract of the ES, accounts slippage, and was performed on a random time period from April 11th through July 22nd of 2022. Further results remain consistent.
This cycle's main function is finding the wind at your back each hour- instead of pinpointing exact tops and bottoms. The Periodic Cycle can confirm whether or not that bottom is worth buying, or if the market is topping out at that high. The Periodic Cycle is taught in our "W. D. GANN: MASTER THE MARKETS" Training
We've chosen a couple days below to illustrate how the Periodic Cycle plays out on the $TICK Index and SPY EFT as well. These two days, September 24th and 28th, were picked because the cycle begins in different places on each day, and interacts with different trends.
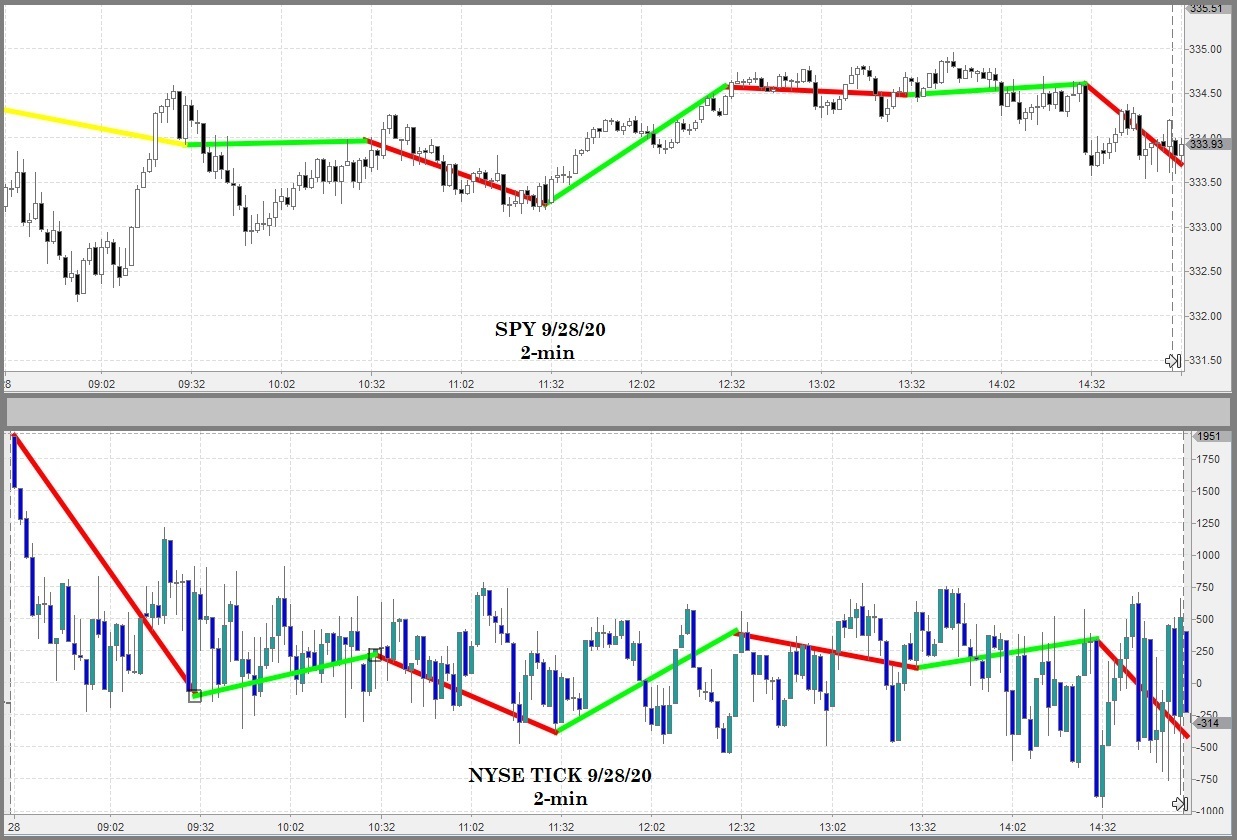
Let’s look at the 28th below first, because the application of the cycle is simpler. The first thing we notice is that the cycle headed down into the market open. We know the length of the cycle in advance, and therefore confirm that there will be institutional selling for the first 30 minutes or so. While this cycle leg is still declining, the $TICK shoots up above 1000. During a declining TICK cycle leg, this divergence gives us a window for a selling opportunity most market participants miss.
We know the market is strong on this day when it bobs up above the open during a cycle of institutional selling. When the Periodic Cycle changes to up just before 9:30am CST, we see the price diverge, as does the $TICK. In an up trend, we are seeing a buyable pullback. The cycle then dictates the up and down waves in the market for the rest of the day.
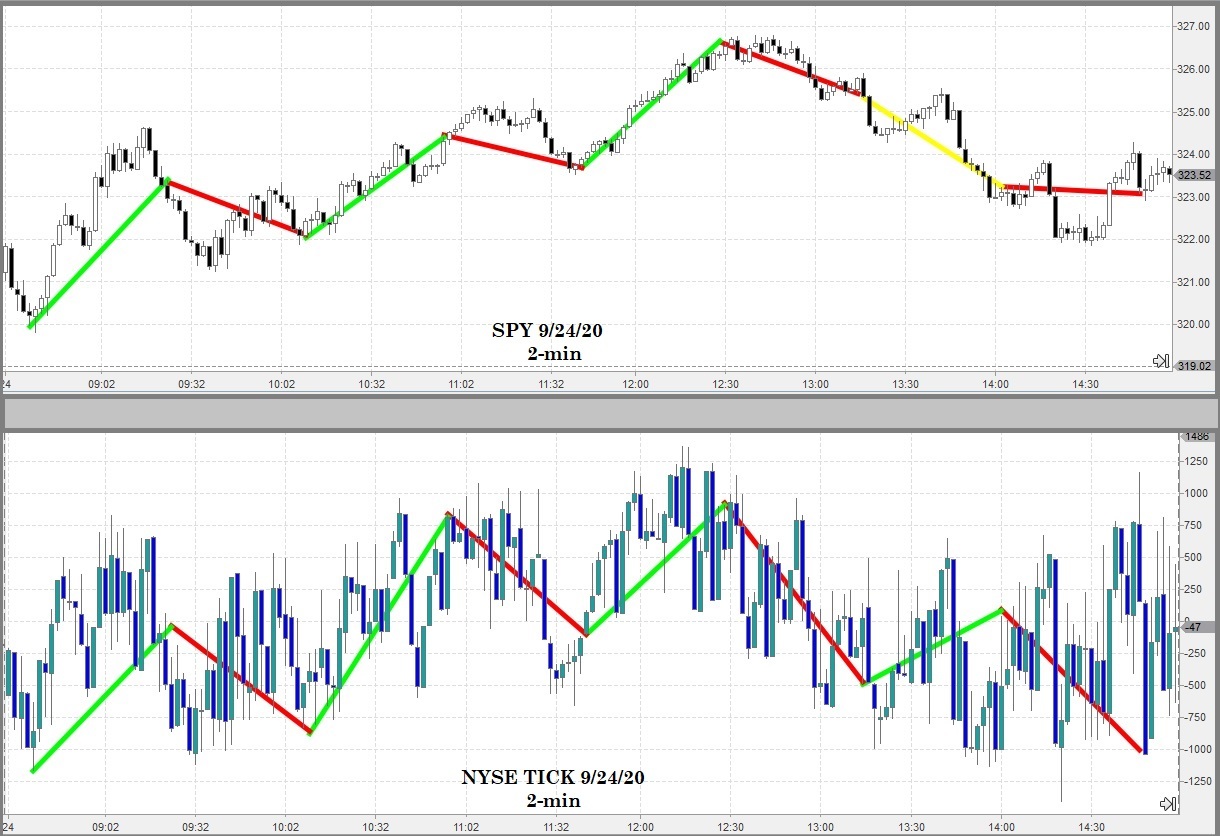
Now let's turn our attention to the 24th. Our formula tells us that the cycle starts a bit later after the open on this day. The 24th is choppier, and there hasn’t been a huge up move on the futures preceding the open.
So on this day the Periodic Cycle as seen on the $TICK more closely defines the up and down alternations in the price data. Divergences of both price and $TICK to the cycle direction are smaller, but still mark great entry points. On days like these, the points at which the alternating legs change from up to down take over in marking entries.
UPCOMING EVENTS...
EMPIRE NEWSLETTER 2023 FORECAST
March 2023Master The Markets
September 8th, 2023 ONLINEDISCLAIMER
Futures, Equities, and Options trading/investing has large potential rewards, but also large potential risk and is not suitable for everyone. You must be aware of the risks and be willing to accept them in order to invest in the equities, futures and options markets. Do not trade with money you can’t afford to lose. This is neither a solicitation nor an offer to Buy/Sell futures, stocks or options on the same. No representation is being made that any account will or is likely to achieve profits or losses similar to those W. D. Gann claimed or anything shown on this website. The past performance of any trading method, strategy, or technical analysis technique, system or methodology is not necessarily indicative of future results. No one associated with this seminar or Tradingwdgann.com are Registered Investment Advisors, Commodity Trading Advisors, or certified, registered, affiliated or approved in in any way with either the National Futures Association, Securities and Exchange Commission, Commodities Futures Trading Commission, or any other organization.
“Master The Markets” exegetes and replicates, as accurately as possible, the original technical analysis, strategies, and market techniques of the late W. D. Gann; and not necessarily the exact trading methods of course presenter or any other individual or entity. You may not be able to duplicate the results of W. D. Gann for many reasons, including, but not limited to, skill of the individual and the changes in financial markets since Gann wrote about them. Recipients of this course receive hypothetical, back–tested data and not actual trading results. Technical analysis, indicators, strategies, and market techniques, including any descriptions or evaluations of their performance, included in this course and displayed on this website, are described and evaluated based on hypothetical back-testing, and not the actual trades or earnings of any individual or entity. Back-tested results should never be interpreted as "typical." Includes far more applications to market instruments and time frames than the presenter can possibly implement. Author & presenter has sources of income in addition to his work with financial markets. In any and all descriptions of this course, or any information displayed on this website, no individual or entity, including past clients or course presenter, “hold themselves out” as achieving any level of success trading or amassing any level of wealth or income derived from any course offered on this website or any or all of the information displayed on this website.
“Master The Markets” teaches the individual technical analysis, market methods, strategies, and indicators we believe W. D. Gann used in financial markets, occasionally demonstrated by showing different ways Gann combined them to work together. Neither These combinations, nor anything displayed on this website or offered in any course on this website constitute a “futures trading system” or a “stock trading system.” Nothing shown or described on this website should be taken as any individual or entity claiming, inferring, or insinuating, investment advice in any way. No one associated with course or this website accurately verifies or tracks results of past clients.
CFTC RULE 4.41HYPOTHETICAL OR SIMULATED PERFORMANCE RESULTS HAVE CERTAIN LIMITATIONS. UNLIKE AN ACTUAL PERFORMANCE RECORD, SIMULATED RESULTS DO NOT REPRESENT ACTUAL TRADING. ALSO, SINCE THE TRADES HAVE NOT BEEN EXECUTED, THE RESULTS MAY HAVE UNDER-OR-OVER COMPENSATED FOR THE IMPACT, IF ANY, OF CERTAIN MARKET FACTORS, SUCH AS LACK OF LIQUIDITY. SIMULATED TRADING PROGRAMS IN GENERAL ARE ALSO SUBJECT TO THE FACT THAT THEY ARE DESIGNED WITH THE BENEFIT OF HINDSIGHT. NO REPRESENTATION IS BEING MADE THAT ANY ACCOUNT WILL OR IS LIKELY TO ACHIEVE PROFIT OR LOSSES SIMILAR TO THOSE SHOWN.


