THE W. D. GANN FAN (OR ANGLE)
Traders know W. D. Gann best by his famous 'Gann fans' or 'angles.' We still see the shadows of these fans on Gann's hand-drawn charts.
W. D. Gann had specific functions for his fans and angles, and set them up differently for each function. For instance, one use of the fans was setting a moving average of price/time. Another was to monitor the strength of a breakout from his Gann Squares. Yet another was to gauge strength of a new trend off a top or bottom. Perhaps Gann's most powerful use was confirm support and resistance prices in advance, pegging tops and bottoms.
Further, Gann used different settings for different for each function of the fan or angle. The Law of Vibration for each market and the timeframe Gann traded determined those settings. Trying to incorporate Gann Fans into your trading without this knowledge will probably just help you lose money. Using a one-to-one price/time ratio without a sound anchor fails quite often.
Further, Gann used in set the fan or angle different for each function. The Law of Vibration for each market and the timeframe Gann traded determined those settings. These angles were only tools of confirmation or triggers that W. D. Gann combined with his core methods of trend prediction, price projection, and more.
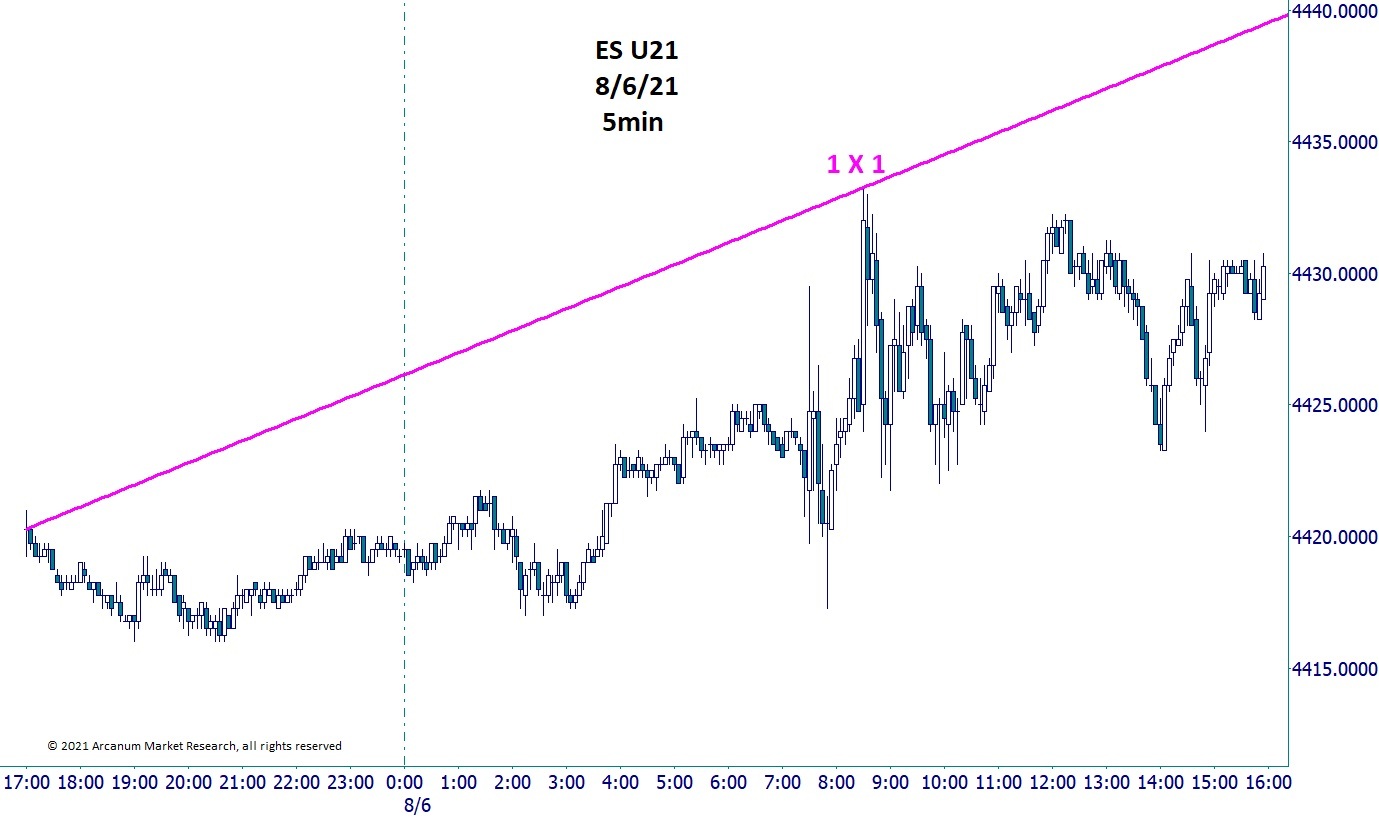
The examples of Gann Angles on this page work consistently because they are set according to Gann's original law of vibration for this market.
The fans above (just the 1 X 1 and 1 X 2s used in first series) is set according to their purpose: to confirm top or bottom prices each day generated by Wheel 24, range, and LOV. Notice how only those angles are necessary to be deadly accurate each day! NOTE: the angles catch the top or bottom of the regular US equity session.
These scaling formulas are constants, calculated for each market and time period. They change in a predictable pattern, which is taught in its entirety in our "Magic In The Markets" Course.
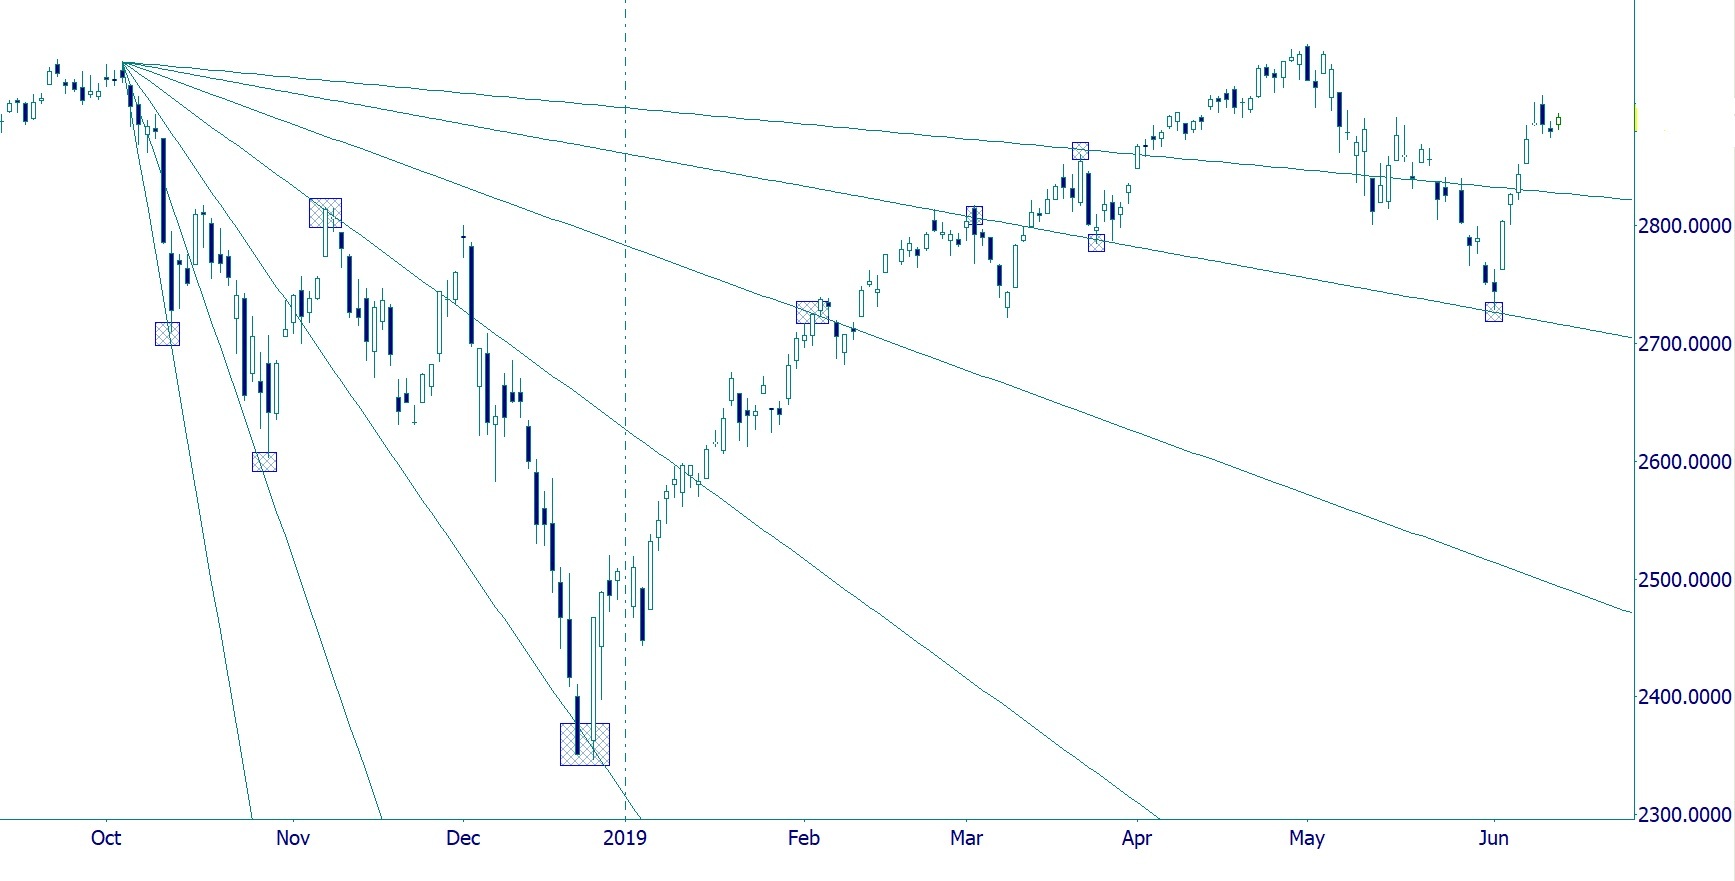
This technique was affectionately named the "Vampire Vector" by Brian S, an alumn of our Gann course. Following the recent series of days is another from 2019 showing the entire angles of the fan.
The Gann Fan above uses different predefined settings in order to find resistance points from any high or low. Different purpose, different formula.
Our new Gann Center is located directly on River Road just seconds from Chicago's O'Hare International Airport in the heart of all major hotels and restaurants in Chicago's Rosemont Entertainment District.
VIEW OUTLINE & SCHEDULE. "Magic In The Markets" includes:


