GANN MECHANICAL METHOD ON THE INDIAN NIFTY 50 INDEX
See the data below for how W. D. Gann’s original Mechanical Method performs on the Nifty 50 Indian Equities Index.
Our most recent discovery from the works of W. D. Gann has been his Mechanical Method applied to the Indian Nifty 50 Equities Index on the National Stock Exchange of India. Gann developed a different Mechanical Method for The United States Equity Indexes, grains, and soybeans in his day. He wrote about these in the body of works that we label the Gann “Stock Market Course” and “Commodities Course.”
You can see about how Gann’s Mechanical Method performs on the S&P 500 by clicking here. W. D. Gann’s methods operate uniquely on each market and time frame, so we were unable to automatically assume that the same rules would apply to historically new markets like the Indian Nifty 50 Index.
Gann’s Mechanical Method Is set apart from his other trading methods in that the Mechanical Method does not use astro or numerology. Neither does it require any indicators or conventional technical analysis.

The Mechanical Method uses proprietary times and prices, and an ancient 2-to-7 day pattern that runs through many markets. What has happened in the market over some portion of the last 7 trading days will determine whether you buy or sell, and exactly at what price, in the next 24 hours. The immediate history of this pattern will
also determine targets and stops.
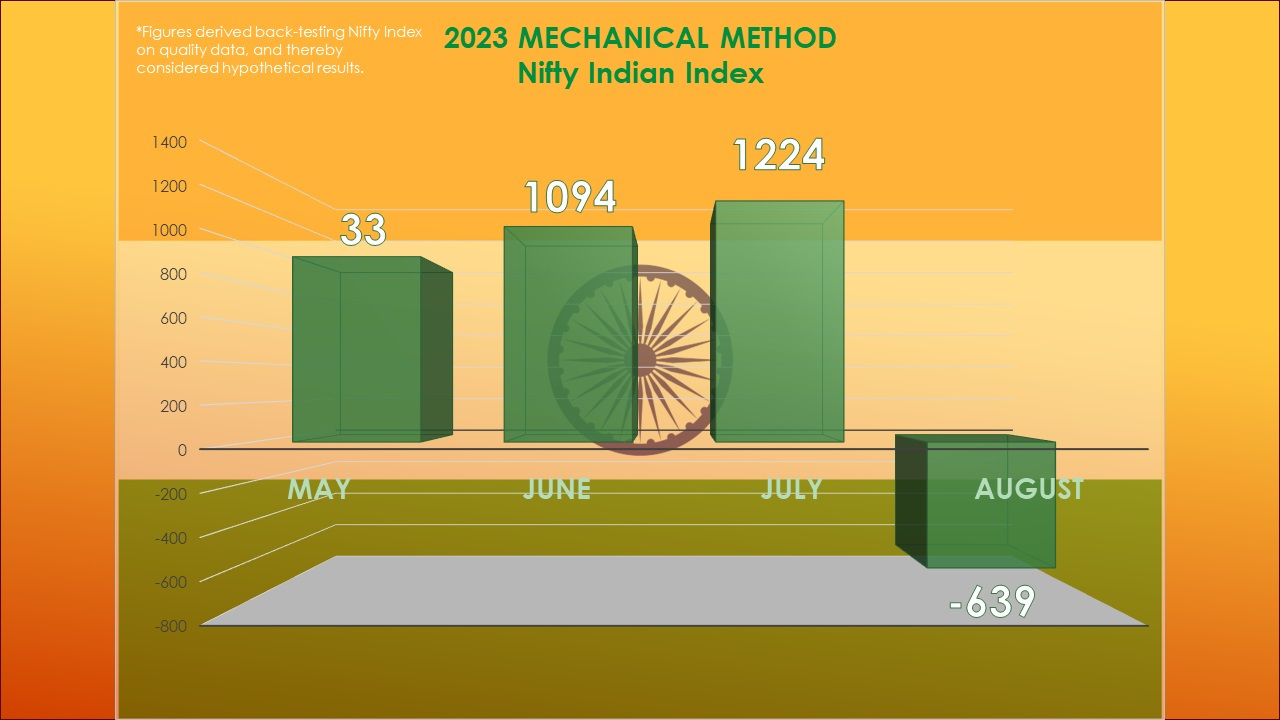
See the graphs on this page for how W. D. Gann’s Mechanical Method performs on the Nifty 50 Indian Equities Index over the last 15 months. These results were obtained using the Nifty Index confined to the regular Indian trading session for the indexes and can be traded using the Nifty futures.
Nifty Indian Index 2023
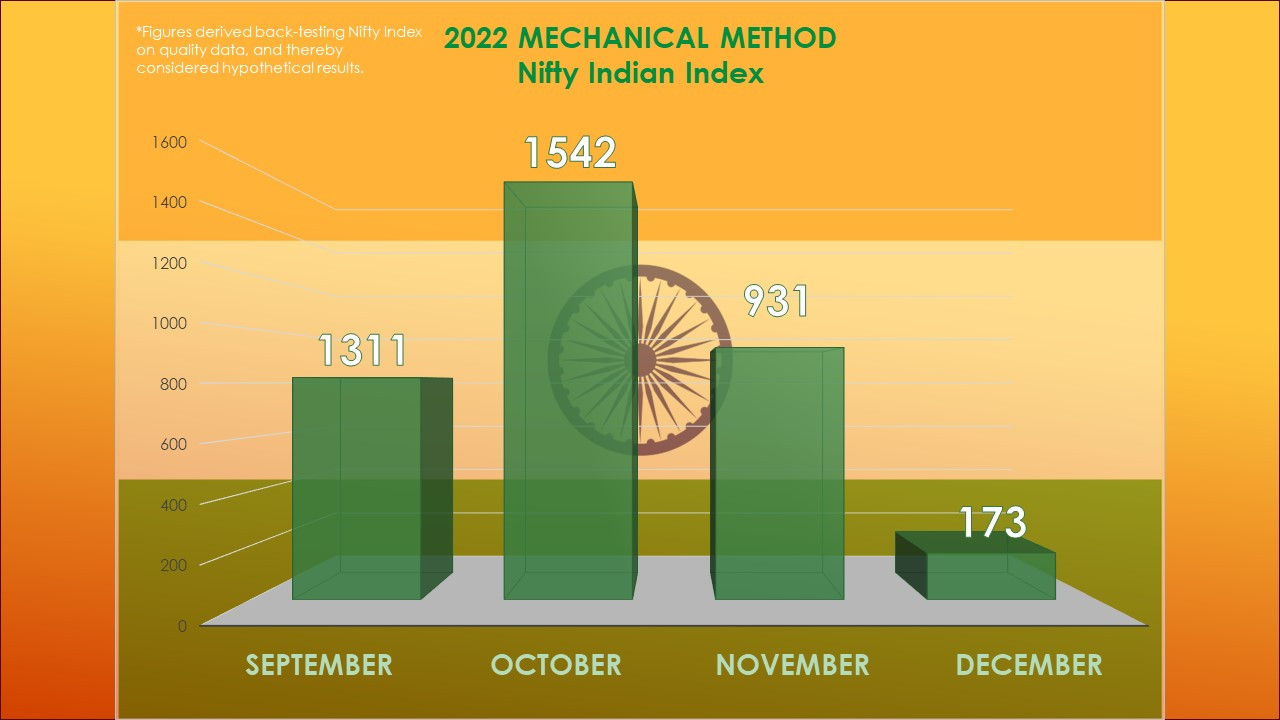
Nifty Indian Index 2022
The full Gann Mechanical Method as applied to the Nifty 50 Indian Equities Index is taught in its entirety in our “W. D. Gann: Magic in the Markets” Training. See graph above for Gann’s Mechanical Method’s performance on the Nifty 50 for 2022 displayed on a monthly return basis of net points positive.
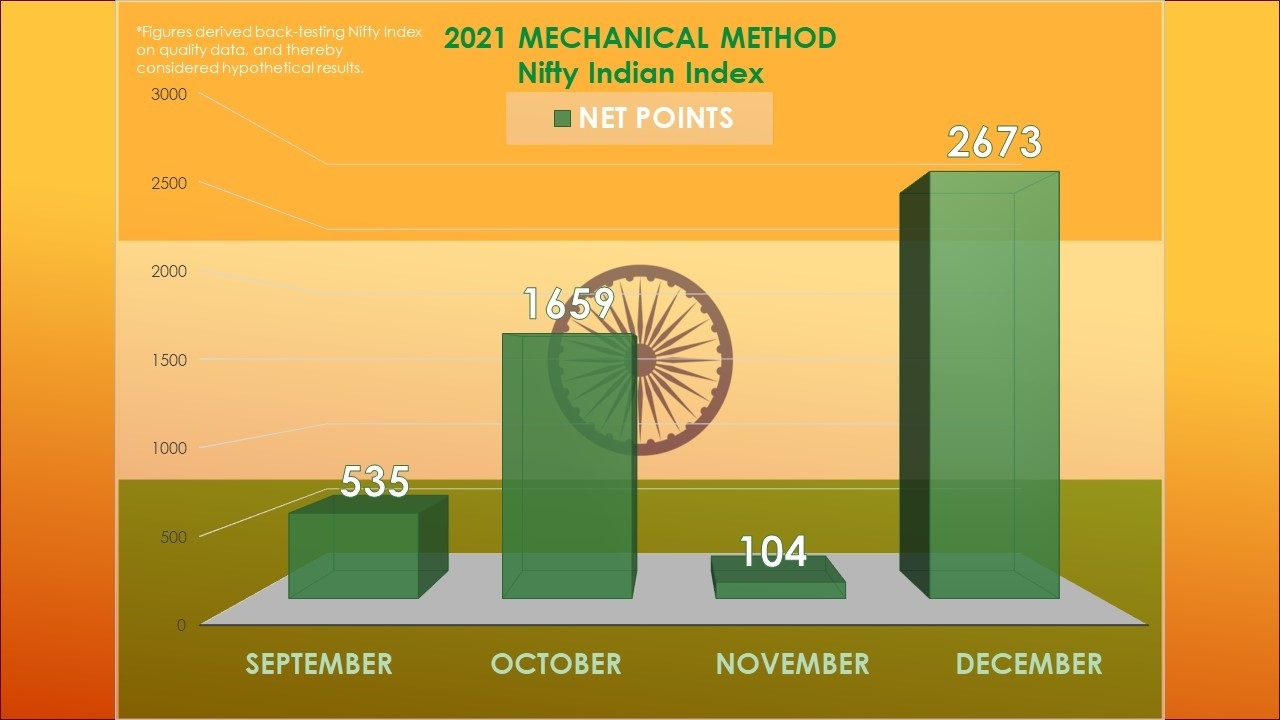
The same monthly returns for 2021 can be seen by scrolling through the slideshow below. All results shown were back-tested at least separate 3 times for verification using W. D. Gann’s same objective ruleset on the Nifty 50 Index data from the NSE. Therefore, these results must be considered hypothetical.
Nifty Indian Index 2021
As this discovery is new, very shortly we will be displaying the results for 2021, 2020, and 2019 on the Indian Nifty 50 Index on this page. Please check back regularly for the results.


