THE MARKET GEOMETRY OF LUTHER JENSEN
Evidence suggests Luther Jensen and W. D. Gann were colleagues. In Jensen's book, "Astro Cycles in Speculative Markets," Jensen briefly but succinctly outlines and illustrates an incredible market geometry on page 111. The surrounding chapters add detail to the technique.
We are unable to find anyone else who has been able to publicly demonstrate Jensen's method on other markets or timeframes other than the 90 week schematic on US Steel that Jensen outlines. Until now.
The key to using Jensen market Geometry with incredible accuracy on virtually every market lies in what Luther Jensen omitted from his charts. Gann's astro-numerological key based in the Law of Vibration makes Jensen's geometry work by tuning it to each market and timeframe you are using. All of Jensen's methods are taught in entirety in our "W. D. GANN: MASTER THE MARKETS" Training.
Decoded from both Jensen's work and Gann's section on Descartes in "The Tunnel Thru The Air," Jensen uses the physics principle of parallel lines drawn through future infinite points, which we call astral points. Jensen showed these future points as points in a square, but of course he is doing much more than he is showing you. In Jensen's chart on page 111, Jensen uses a 90 week square with US Steel because the points appear as the square sides. These astral points equate to fixed mathematical points on market charts that exist before and outside of market data.
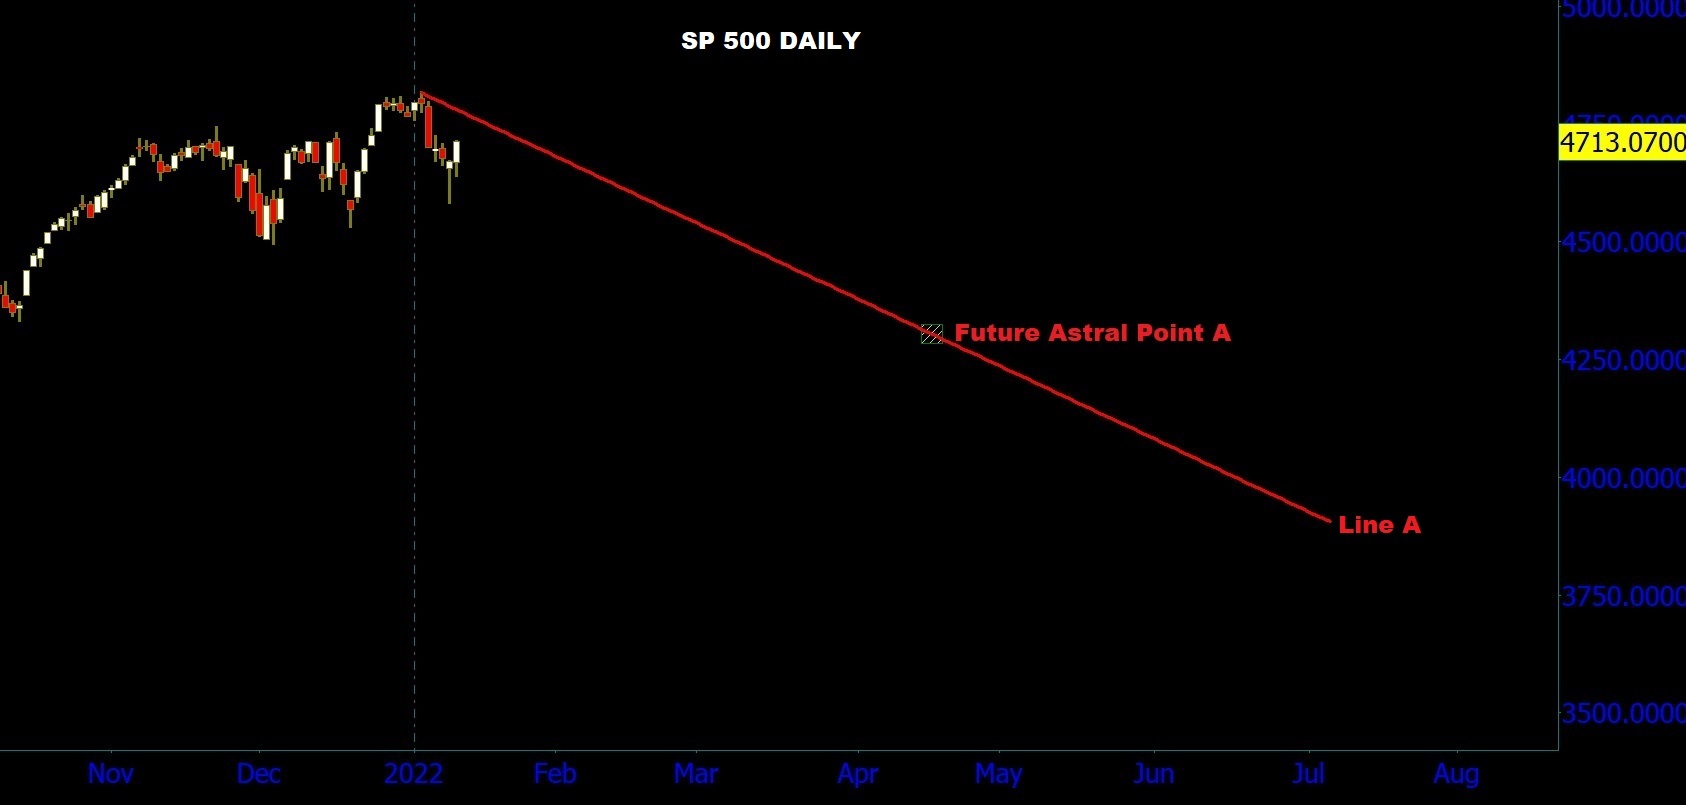
Scroll through the gallery below of Luther Jensen's market geometry applied to the SP 500 as it begins 2022. The slideshow is setup to first draw each line through a future astral point as soon as the market makes a high or low. Then that line is copied and applied to a previous pullback or pivot before market data fills in the chart. Then market data continues and usually hits the copied line and bounces off. Where price touches a line is shown to coincide with Law of Vibration price projection.
Luther Jensen's original market geometry is taught in it's entirety in our "W. D. GANN: MASTER THE MARKETS" Training. This method works on most major active, liquid market and timeframes. Gann combined these lines with law of Vibration price projections for highs, lows, and pullbacks. This combination is also included.
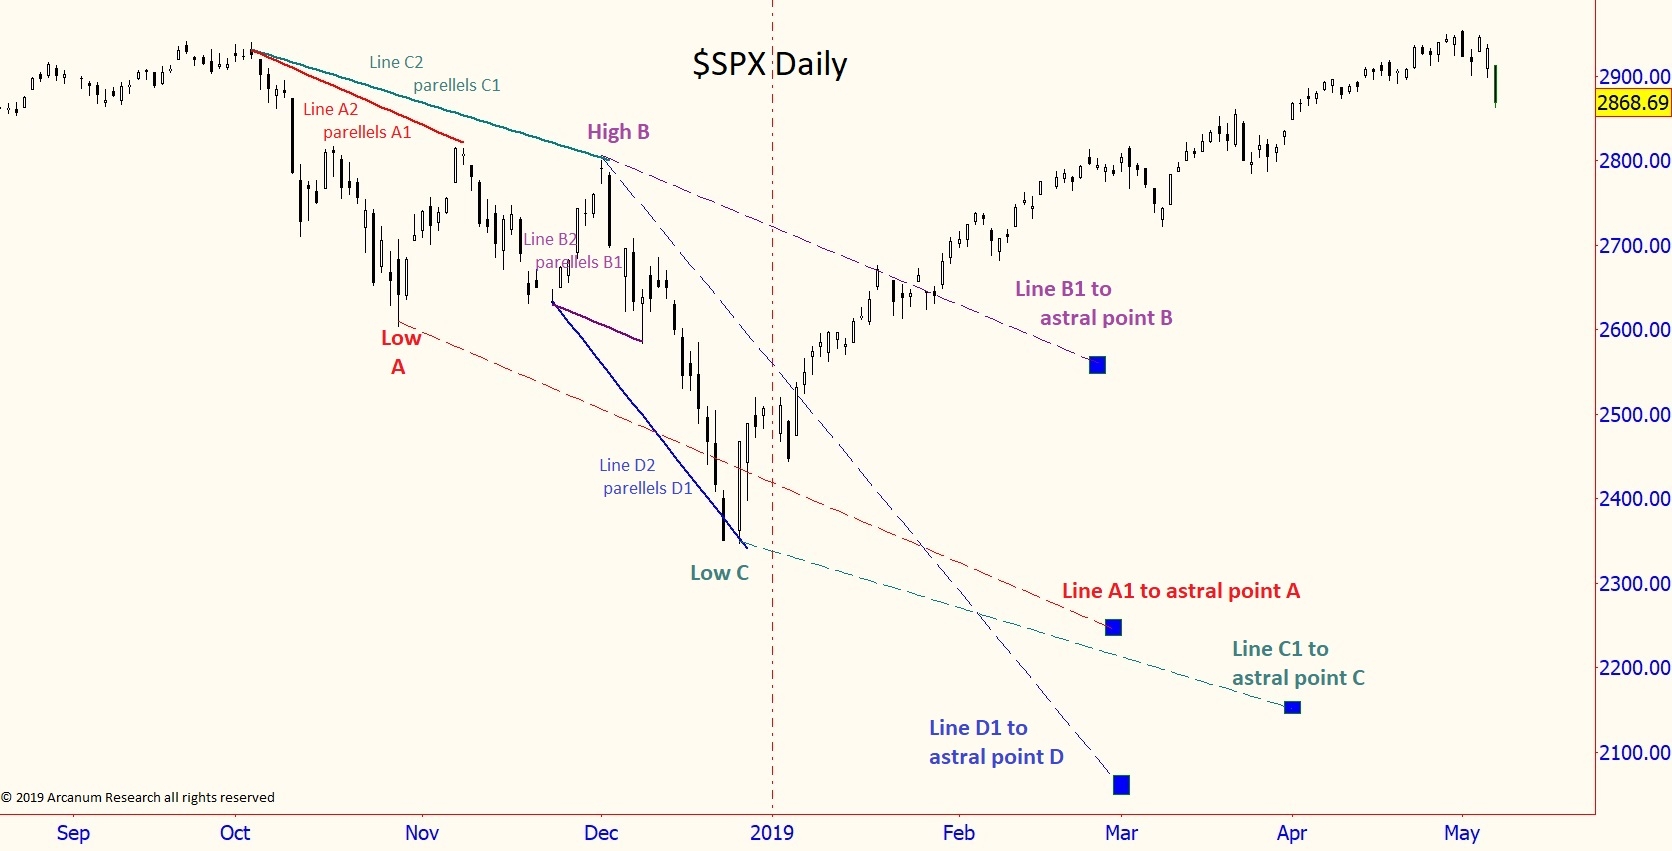
If you want to see Jensen's geometry on one chart, see the daily chart of the SP 500 Index for 2019 and narrative below. Jensen lines drawn from highs and lows through these infinite mathematical (astral) points, which are always fixed, objective, and predictable. Then we created a parallel line to the lines we just drew and extended it from the previous high or low pivot to forecast the next top or bottom or support and resistance. See expandable chart below and following explanation.
A. First, the market makes "Low A" (red) in late October 2018 and then pulls back. We first draw line A1 (red) from Low A to our first mathematical point. Remember, we do this in late October after identifying the low.
A2. Second, we create a parallel line to line 1A, with the exact same pitch. We call this A2, also in red. We then move A2 to begin at the open of the high day around October 3rd that began the run to the low. Notice that it provides exact resistance for the pullback high in early November.
B. The market then droops and pulls up for a double top December 2nd at high B (purple,) We draw a new line 1B (purple) from High B to another astral point on our mathematical line.
B2. We now create a new line, B2 (purple,) which is parallel to B1 with the exact same slope. Then we move B2 to start on the last pivot low below High B. Notice B2 provides exact support for the decline low from B1.
D. The market now declines below the support marked by B2. We now draw a new line, D1 (blue) from the same high, High B (purple,) through yet another mathematical point on our grid (that is invisible to you, but not us.)
D2. We now create a new line, D2 (blue,) that is parallel to D1, with the exact same pitch. Then we move D2 (blue) to start at the pivot low right before High B. Notice how D2 (blue) provides exact support for the big low at the end of December 2018.
C. Lines C1 and C2 (Teal) are drawn from Low C and moved to the first high to show the relationship of the principle. The illustration would not be tradeable in real time but shows you the forces that underlie the market.
We want to underscore how Luther Jensen's geometry method is simple, consistent, and practical, especially compared to all the nonsense out there that is labelled market geometry or Gann. W. D. Gann and Luther Jensen focused on this method because it provided highly accurate and consistent confirmation of highs, lows, and the end of a trend by providing extremely strong support and resistance. the technique also moved dynamically with the market.
We would also emphasize the simplicity and ease of this method. Even though there are invisible points on this chart made evident for illustration by our blue dots, these points can be drawn on any chart in 1 minute, and are the same every time. It allows for concrete rules and objectivity.


