W. D. GANN GOLD TRADING STRATEGIES
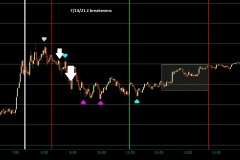
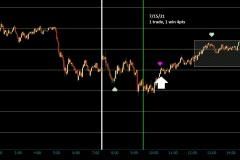
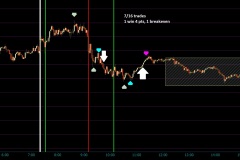
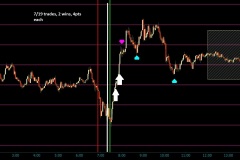
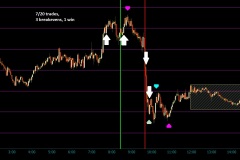
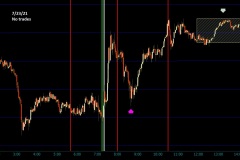
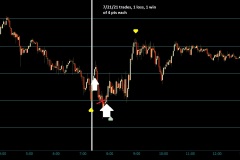
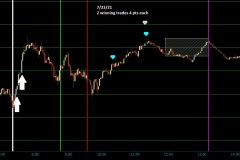
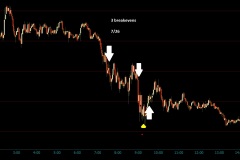
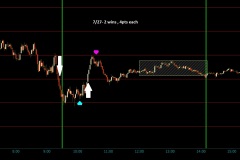
Below are just a few of the trading strategies of W. D. Gann applied to the modern gold futures market. Gann wrote about gold trading in his "Silver Springs" chapter of 'The Tunnel Thru The Air.'Gann's classic trading methods also work amazing on gold. Integrating the Silver Springs cycle with Gann's "Arcana" Trend Cycle, we get the foundation for one of Gann's classic trading strategies. We call it "Goldfinger." Goldfinger Daily combines the Silver Springs/Arcana foundation with classic Gann trading rules, like his Angle and Balanced Entry Methods. You can read more about the individual Arcana Trend Cycles and Silver Springs Metal Trading Cycle. These strategies are taught in their entirety in our "W. D. Gann: Master The Markets" Training. Scroll through and expand the gallery below to see every trade generated from Goldfinger for Gold daily for the years 2022- 2024. When we first posted this gold trading strategy, we received a ton of emails and inquiries. Many of you asked if we could upload white charts instead of black, and show the interplay between the Arcana trend forecast and Silver Springs Cycle on the chart. The charts above do all that and more. We also tested a slightly cleaner version of Goldfinger that produces more profit on less trades. In the above galleries, Goldfinger II generated 24 trades over the last 3 years on the Gold Daily Chart. Only 3 of these trades ended in losses, 3 were breakevens, and the rest were winners. This adds up to an outlandish 2,204 points assuming each trade entered only 1 contract! That's over 200 points more than Goldfinger I with 3 less trades. There are more Gann daily gold trading strategies than Goldfinger. Scroll through and expand the gallery below for our daily Polarity Line Trades on gold for the years 2022- 2023. Both Goldfinger and the Polarity Lines can be traded simultaneously. Between 2022 through 2024, there were 11 trades generated. All of them were sins except for 3 slippage losses of less than 5 points each. If you took these trades as well, you would have added an additional 265 points on gold over the last 3 years assuming 1 contract per trade. Does Goldfinger work on other timeframes with gold? Why, yes it does. On intraday trading, Goldfinger combines the intraday Arcana Trend Cycle with the Periodic Cycle for gold. This cycle changes every day, but is generated from a fixed point using a mathematical formula before the market data. Right now, we have this strategy worked out beginning with the old COMEX pit start time of 8:20am EST in the US Session. As you scroll through and expand the gallery below, we took several consecutive days (minus a FED day and the day thereafter which we never trade) near the end of 2024. Despite this being a less-than-ideal time of the year to trade, take a look at the results. The green and red arrows represent the Arcana Trend Cycle. These represent W. D. Gann's trend that he advised never to buck. The up and down green and red lines represent the periodic cycle for that day. Both of these are drawn out in advance of market data. Gann's unique trading rules change based on the interaction of these two cycles. Out of the 8 days we looked at, Goldfinger generated 51 trades. 35 were wins, 6 losses, and the rest were break-evens. As also is the case with the daily, the strategy generates targets, stops, and move-stop-to-breakeven signals for every trade. At the end of every day (4pm EST) you are flat. Intraday Goldfinger is also included in our "W. D. Gann: Master The Markets" Training. In the gallery below, the intraday Arcana Trend Cycle is combined with intraday polarity lines. Both are drawn before the market data . These lines shows the hidden breakout/down price behind the scenes of the market. Trades are only taken in direction of the Arcana Trend Cycle. The red and green vertical lines represent trend direction predicted ahead of the market. Red is down, green is up. You will also notice that there are some times/zones where there is no trend (shaded box) or the trend is indeterminate. W. D. Gann intended these zones to act as trade direction filters, only trading in the predicted direction of the trend. The horizontal lines you see are 'polarity," or breakout/down lines which act as entry triggers if price closes above or below them. Our trading session starts at the old pit time of 8:20am Eastern US time. The big white arrows denote trades. By combining these two rule-based methods, we get a system that is entirely objective and rule-based that can be back-tested. The little blue arrows denote predicted ideal times for entries in the direction of the trend in case of a pullback against the trend. The little purple arrows denote ideal times for a market run in the direction of the trend to end or pause. They are not “buy on blue sell on purple” signals.
INTRADAY POLARITY LINE TRADING
UPCOMING EVENTS...
EMPIRE NEWLSETTER 2024-25 FORECAST
March 2024Master The Markets Training
JANUARY 2025DISCLAIMER
Futures, Equities, and Options trading/investing has large potential rewards, but also large potential risk and is not suitable for everyone. You must be aware of the risks and be willing to accept them in order to invest in the equities, futures and options markets. Do not trade with money you can’t afford to lose. This is neither a solicitation nor an offer to Buy/Sell futures, stocks or options on the same. No representation is being made that any account will or is likely to achieve profits or losses similar to those W. D. Gann claimed or anything shown on this website. The past performance of any trading method, strategy, or technical analysis technique, system or methodology is not necessarily indicative of future results. No one associated with this seminar or Tradingwdgann.com are Registered Investment Advisors, Commodity Trading Advisors, or certified, registered, affiliated or approved in in any way with either the National Futures Association, Securities and Exchange Commission, Commodities Futures Trading Commission, or any other organization.
The “Master The Markets” course exegetes and replicates, as accurately as possible, the original technical analysis, strategies, and market techniques of the late W. D. Gann; and not necessarily the exact trading methods of course presenter or any other individual or entity. You may not be able to duplicate the results of W. D. Gann for many reasons, including, but not limited to, skill of the individual and the changes in financial markets since Gann wrote about them. Recipients of this course receive hypothetical, back–tested data and not actual trading results. Back-tested results should never be interpreted as "typical" results. Technical analysis, indicators, strategies, and market techniques, including any descriptions or evaluations of their performance, included in this course and displayed on this website, are described and evaluated based on hypothetical back-testing, and not the actual trades or earnings of any individual or entity. Includes far more applications to market instruments and time frames than the presenter can possibly implement. Author & presenter has sources of income in addition to his work with financial markets. In any and all descriptions of this course, or any information displayed on this website, no individual or entity, including past clients or course presenter, “hold themselves out” as achieving any level of success trading or amassing any level of wealth or income derived from any course offered on this website or any or all of the information displayed on this website.
“Master The Markets” teaches the individual technical analysis, market methods, strategies, and indicators we believe W. D. Gann used in financial markets, occasionally demonstrated by showing different ways Gann combined them to work together. Neither These combinations, nor anything displayed on this website or offered in any course on this website constitute a “futures trading system” or a “stock trading system.” Nothing shown or described on this website should be taken as any individual or entity claiming, inferring, or insinuating, investment advice in any way. No one associated with course or this website accurately verifies or tracks results of past clients.
CFTC RULE 4.41HYPOTHETICAL OR SIMULATED PERFORMANCE RESULTS HAVE CERTAIN LIMITATIONS. UNLIKE AN ACTUAL PERFORMANCE RECORD, SIMULATED RESULTS DO NOT REPRESENT ACTUAL TRADING. ALSO, SINCE THE TRADES HAVE NOT BEEN EXECUTED, THE RESULTS MAY HAVE UNDER-OR-OVER COMPENSATED FOR THE IMPACT, IF ANY, OF CERTAIN MARKET FACTORS, SUCH AS LACK OF LIQUIDITY. SIMULATED TRADING PROGRAMS IN GENERAL ARE ALSO SUBJECT TO THE FACT THAT THEY ARE DESIGNED WITH THE BENEFIT OF HINDSIGHT. NO REPRESENTATION IS BEING MADE THAT ANY ACCOUNT WILL OR IS LIKELY TO ACHIEVE PROFIT OR LOSSES SIMILAR TO THOSE SHOWN.