CONFLUENCE IN PRICE AND TIME PROJECTIONS
Those who have seriously studied W. D. Gann know that he always used a confluence of several methods to predict price and time.
On this page, we will use the SP 500 and intraday timeframe to demonstrate how Gann combined many methods of both price and time to make high-probability predictions of market LOD/HOD and the ends of pullbacks. For time methods. Gann used 4 favorite methods in confluence to predict turn times: Square Outs, Turn Times, Reverse LOV, and TOP/BOTTOM finder.
In terms of price, his favorites were: LOV projections, Range Finder, and Wheel of 24. Here is what few Gann followers understand: price projections and time predictions each use different disciplines and axis in their calculations. Gann did much more than use one simple wheel to find a magical time and price where the market will turn.
The formula behind each method to accurately project price and time in each market and timeframe, as well as how to put them all together, is broken down in detail in our "W. D. GANN: MASTER THE MARKETS" Training.
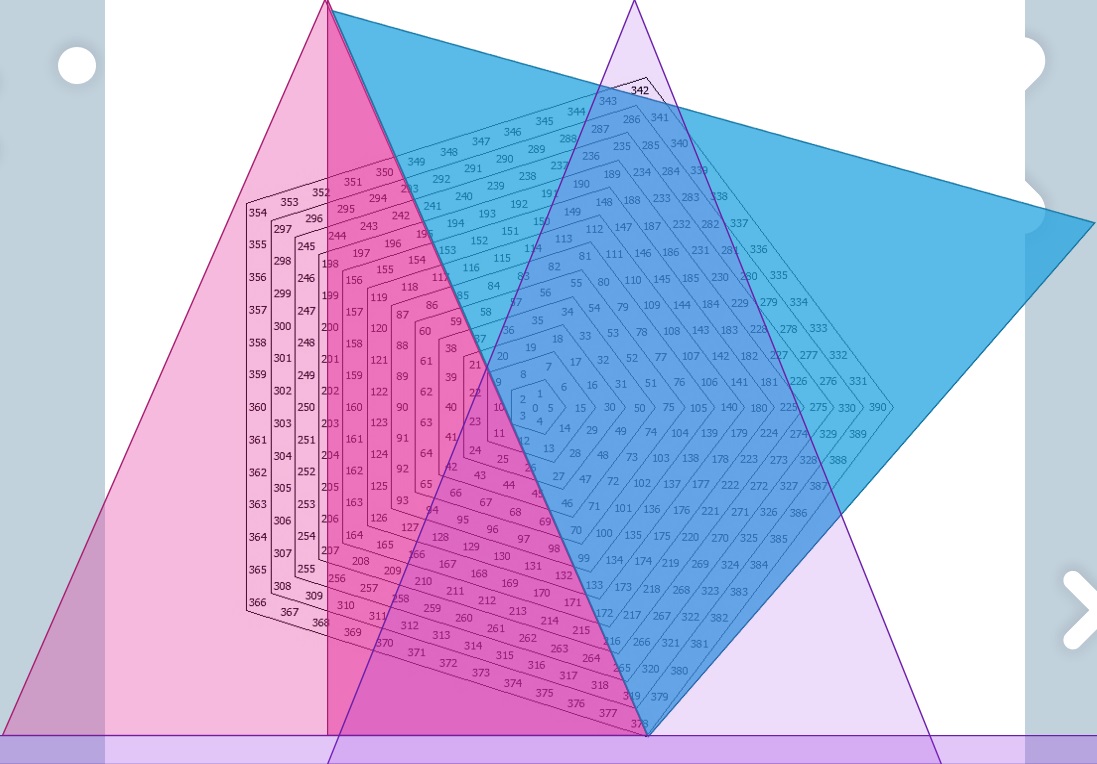
TRADING WITH THE NUMBERED SQUARES
Scroll through the pictures below to see some consecutive days of price and turn time predictions. There is a lot of information on these charts. Almost as if someone vomited every Gann technique onto the chart at once. But this is a replication of what Gann did. He always used a confluence of predictive techniques, and always used them in the broader context of Arcana trend predictions, cycles, and price action relative to trend.

Let's describe what you are looking at. First, notice the context of the predictions on each day. The vertical red and green lines denotes predicted trend until the next vertical line (green up, red down). Blue denotes trend neutral. The UP/DOWN cycle at the bottom is the periodic cycle, which is drawn in advance of market data as well. So ideally, the Gann practitioner will acts on the price and time predictions in harmony with the trend and cycle direction at the time.
Next, focus on the little purple boxes. These represent the confluence areas where multiple price and time projections converge. They also account for margin of error in the size of the box. The light blue small horizontal line is the LOV price prediction. The little red horizontal red line is the Range Finder. Range finder finds large increments of price from top to bottom. The purple box is where the two meet. If they are further apart, the Wheel of 24 is used as a tie-breaker.
Now let's looks at time. There are 3 or 4 time predictive tools. Here, we only need 2, but if we get 3 all the better. The light green or purple arrows represent the most likely time for a top or bottom to be made. These first must be confirmed by the market making a new high or low right into this time during the US session. The yellow arrows represent "Bottom/Top Finder" which allows the time to be a LOD/HOD. The white arrows are Square Out time turns. The purple box also accounts for where these time predictions meet AND where they collectively confluence with price.
Another way to look at the purple boxes is that they represent the most likely place where the market, down to an 85% probability, will make a HOD/LOD and turn. So blindly just trade it as a reverse? Remember the context. You must act with Gann's entry techniques and within the context of trend and cycle! Gann preferred to have Arcana and cycle agreeing UP if we are hunting for a bottom to buy. We can also add further features and filters, such as customized Gann indicators tuned to the cycle of each market, day, and timeframe.
You might have noticed other markings on the charts. For instance, the light blue arrows are Minor Arcana. These are projected in advance of market data as the most likely times that a pullback against the predicted trend will end. Market must confirm by pulling into these times against such trend.
Collectively, the confluence of W. D. Gann's techniques can be likened to night vision or thermal imagery of the behind-the-scenes energy of each market and timeframe. Without these, you are at the mercy of moving averages and MACDs. Trading in harmony with Gann's methods, it becomes really difficult to lose money.
Gann's projections integrated the numbered squares and wheels with the Law of Vibration; as Gann projected specific targets and bounces. Click here for our short target and bounce projections in advance of the market through the Black Swan Crisis.