W. D. GANN'S MECHANICAL METHOD (OVERNIGHT CHART)
In W. D. Gann's 'Stock Market Course' he introduces us to his "Mechanical Method," also called the "Overnight Chart." Gann further elaborates on the method applied to ags in his 'Commodities Course.'

Later in life, Gann becomes a bit frustrated that his students were straining to learn the more intricate astro-based techniques in 'The Truth of The Stock Tape,' and 'The Tunnel Thru The Air.' He then emphasized this simpler but ingenious 'Mechanical' Method as a stand-alone trading method.
Originally designed for the US Indexes, the Mechanical Method identifies a 2 to 4-day trend for its entries and exits. The real beauty of Gann's Mechanical Method is that it is a self-contained trading framework. It works independently of astro and numerology, because it captures a repeating short-term pattern inherent to equity markets. This ancient market pattern determines the trader's risk, reward, and money management.
The Mechanical Method wows you once it is unlocked. Inside of Gann’s wonderful discovery is found timeless principles measuring supply, demand, and near-term market direction. On a chart is simply looks like a bunch of random entries and exits. But the back-testing tells another story. We had to repeat it over and over by hand, because it looked too good to be true. These Mechanical Methods are taught in their entirety in our "W. D. GANN: MASTER THE MARKETS" Training.
See the back-testing results below for the last 51 consecutive months of W. D. Gann's mechanical method on the SP 500. We actually have the logs and trade diaries going back to 2017 detailing the rule that triggered each trade so students can follow along. It is worthy to note that each of the 2 versions of Gann's Mechanical Method tested below only have 1 drawdown month in the last 5 years.
Because W. D. Gann taught both professional traders who had access to the floor data in additional to retail investors, Gann organized different methods to trade the Mechanical Method. Gann delineated a second variant which he earmarked the "Safest" method.
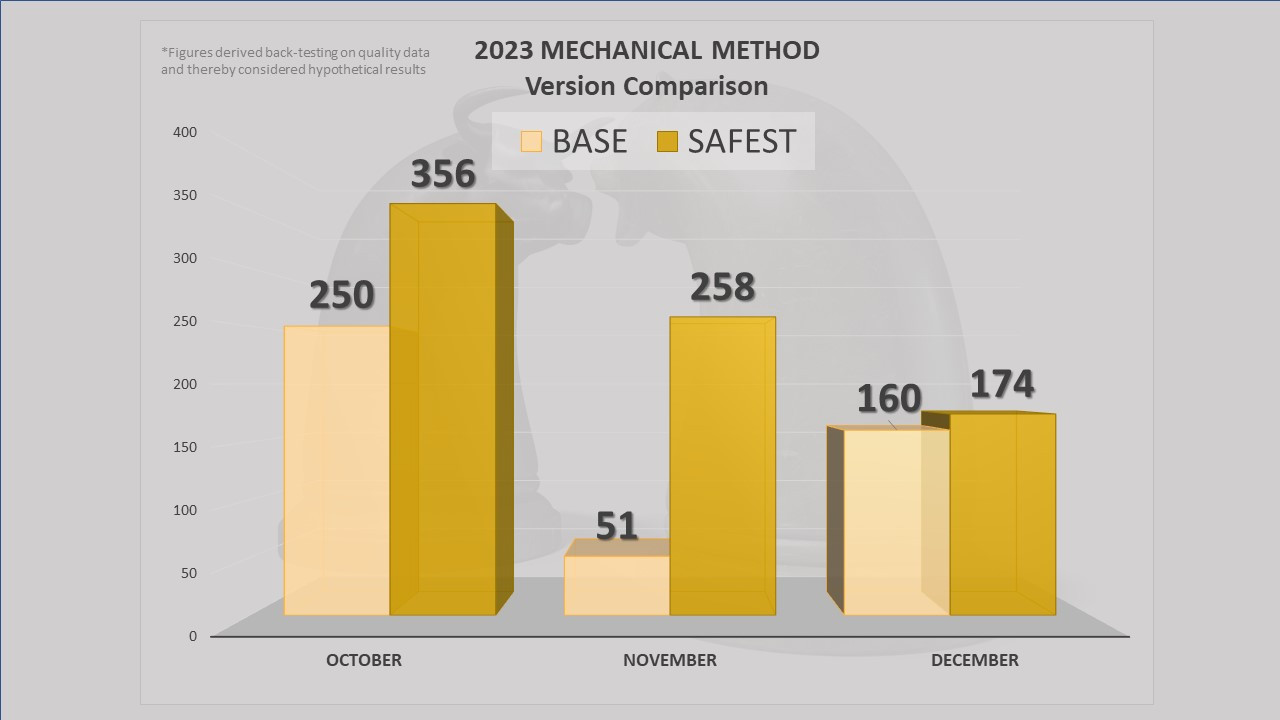
'Pictured above are the back-testing results from both variants of the Gann Mechanical Method for 2023-24, and below for 2020, 2021, and 2022 using ES futures with just 1 contract per signal and 1 contract for runner trades. Results compare Gann's 'Basic' Mechanical Method with his 'Safest.' We have the actual trade diaries going back to 2017 proving these results are consistent. The column numbers represent net point return per month. We would advise shaving 10% off the profitability for slippage.
The Mechanical Method labelled 'Basic' in these panels is the basic method Gann first describes and gives example trades of. The column 'Safest' was the method where Gann added pullback buying, multiple signal entry, and further safeguards which qualified entries.
Gann gave the 'Basic' method to traders who has less access to market data and wanted fewer trades. "Basic' includes more double-reverse stops which could be handled by brokers in the 1940's and 50's. While the 'Basic' method waits until previous trades play out before entering anew, the 'Safest' method enters more lots on each new signal of the same direction.
Trades on both methods usually result in durations of a few hours to a couple weeks. Ideally there is a trade working at most times which is considered a 'runner,' or longer running trade than the first lot.
Though many traders and investors reel at the market volatility of 2020, W. D. Gann's Mechanical Method seems to work better.
These Mechanical methods are taught in their entirety in our "W. D. GANN: MASTER THE MARKETS" Training.
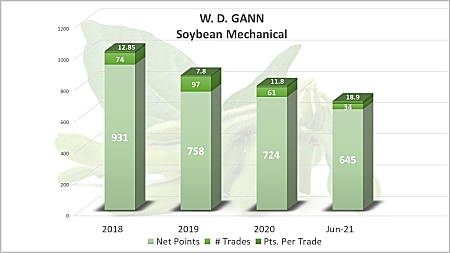
W. D. GANN SOYBEAN MECHANICAL

Click to expand this graph of results for Gann's Soybean Mechanical System for the last 4 years. The Soybean Mechanical Method works on a similar principle as the basic Mechanical Method does on US Indexes, but the details are substantially different. The timeframe and cycle are a bit longer. Like the previous Mechanical Method.
EMPIRE NEWSLETTER 2024 FORECAST
March 2024Master The Markets
April 27th, 2024 ONLINEDISCLAIMER
Futures, Equities, and Options trading/investing has large potential rewards, but also large potential risk and is not suitable for everyone. You must be aware of the risks and be willing to accept them in order to invest in the equities, futures and options markets. Do not trade with money you can’t afford to lose. This is neither a solicitation nor an offer to Buy/Sell futures, stocks or options on the same. No representation is being made that any account will or is likely to achieve profits or losses similar to those W. D. Gann claimed or anything shown on this website. The past performance of any trading method, strategy, or technical analysis technique, system or methodology is not necessarily indicative of future results. No one associated with this seminar or Tradingwdgann.com are Registered Investment Advisors, Commodity Trading Advisors, or certified, registered, affiliated or approved in in any way with either the National Futures Association, Securities and Exchange Commission, Commodities Futures Trading Commission, or any other organization.
“Master The Markets” exegetes and replicates, as accurately as possible, the original technical analysis, strategies, and market techniques of the late W. D. Gann; and not necessarily the exact trading methods of course presenter or any other individual or entity. You may not be able to duplicate the results of W. D. Gann for many reasons, including, but not limited to, skill of the individual and the changes in financial markets since Gann wrote about them. Recipients of this course receive hypothetical, back–tested data and not actual trading results. Technical analysis, indicators, strategies, and market techniques, including any descriptions or evaluations of their performance, included in this course and displayed on this website, are described and evaluated based on hypothetical back-testing, and not the actual trades or earnings of any individual or entity. Back-tested results should never be interpreted as "typical." Includes far more applications to market instruments and time frames than the presenter can possibly implement. Author & presenter has sources of income in addition to his work with financial markets. In any and all descriptions of this course, or any information displayed on this website, no individual or entity, including past clients or course presenter, “hold themselves out” as achieving any level of success trading or amassing any level of wealth or income derived from any course offered on this website or any or all of the information displayed on this website.
“Master The Markets” teaches the individual technical analysis, market methods, strategies, and indicators we believe W. D. Gann used in financial markets, occasionally demonstrated by showing different ways Gann combined them to work together. Neither These combinations, nor anything displayed on this website or offered in any course on this website constitute a “futures trading system” or a “stock trading system.” Nothing shown or described on this website should be taken as any individual or entity claiming, inferring, or insinuating, investment advice in any way. No one associated with course or this website accurately verifies or tracks results of past clients.
CFTC RULE 4.41HYPOTHETICAL OR SIMULATED PERFORMANCE RESULTS HAVE CERTAIN LIMITATIONS. UNLIKE AN ACTUAL PERFORMANCE RECORD, SIMULATED RESULTS DO NOT REPRESENT ACTUAL TRADING. ALSO, SINCE THE TRADES HAVE NOT BEEN EXECUTED, THE RESULTS MAY HAVE UNDER-OR-OVER COMPENSATED FOR THE IMPACT, IF ANY, OF CERTAIN MARKET FACTORS, SUCH AS LACK OF LIQUIDITY. SIMULATED TRADING PROGRAMS IN GENERAL ARE ALSO SUBJECT TO THE FACT THAT THEY ARE DESIGNED WITH THE BENEFIT OF HINDSIGHT. NO REPRESENTATION IS BEING MADE THAT ANY ACCOUNT WILL OR IS LIKELY TO ACHIEVE PROFIT OR LOSSES SIMILAR TO THOSE SHOWN.


