W. D. GANN POLARITY LINES
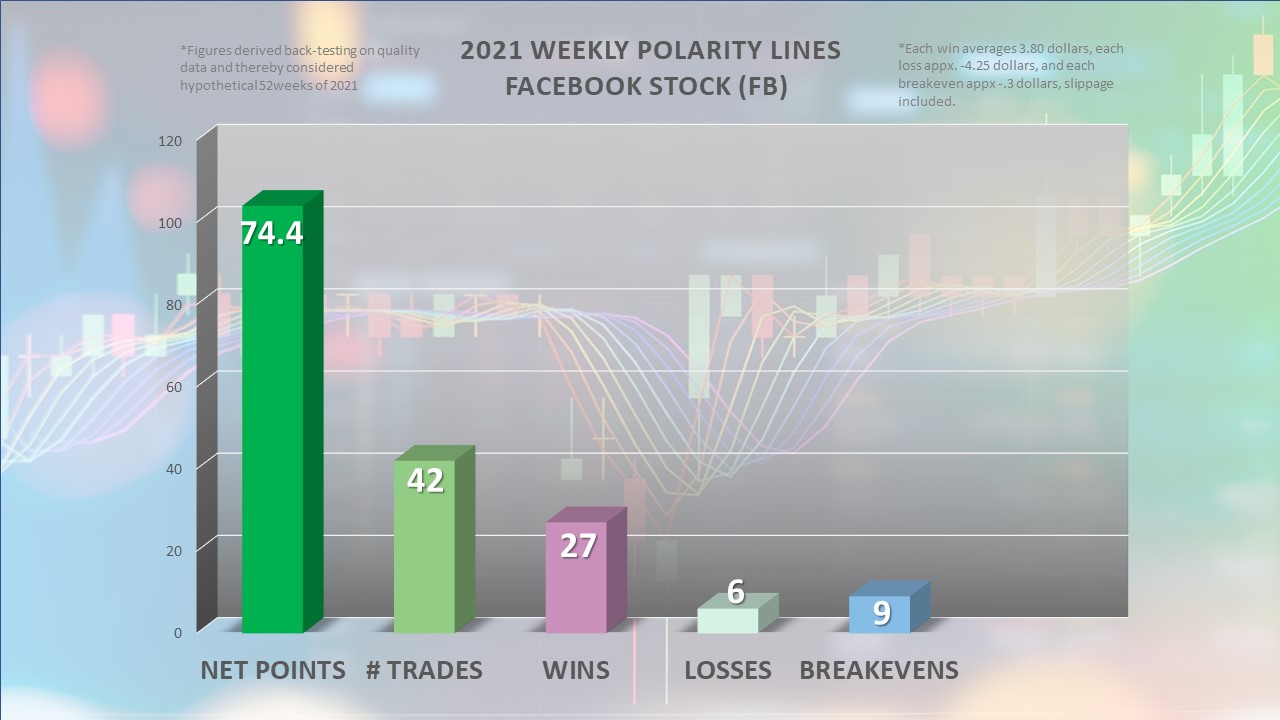
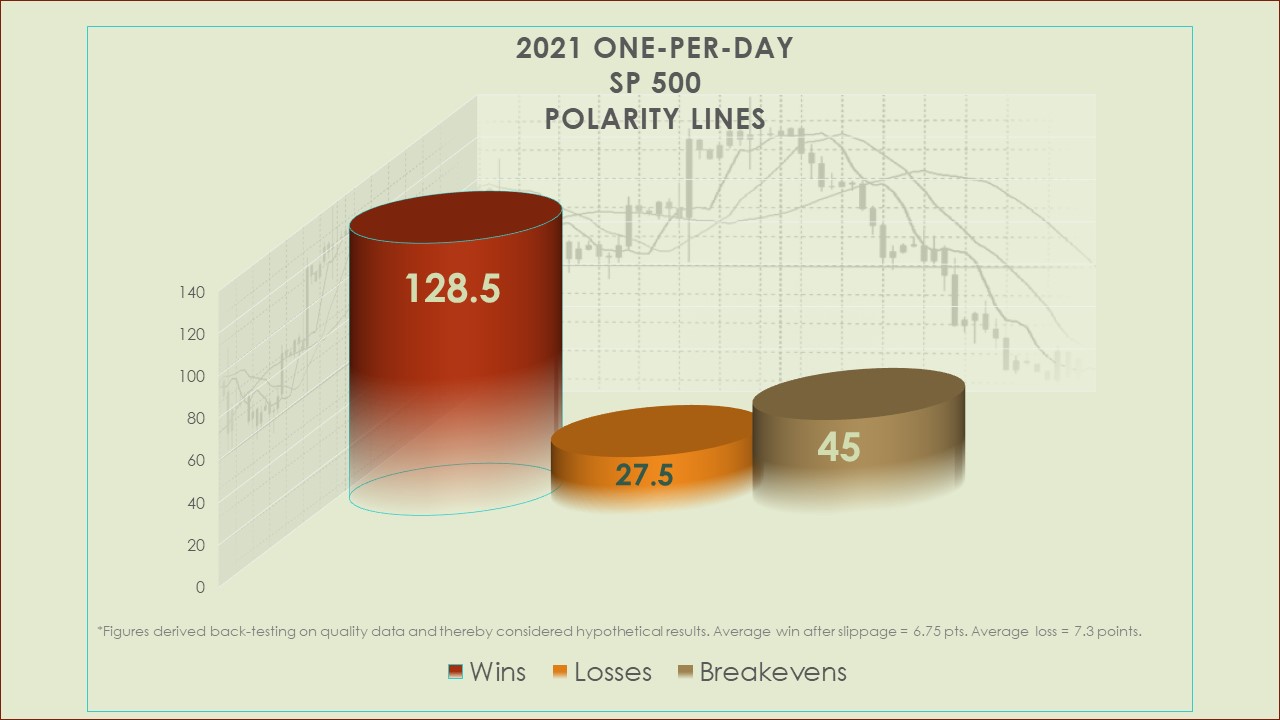
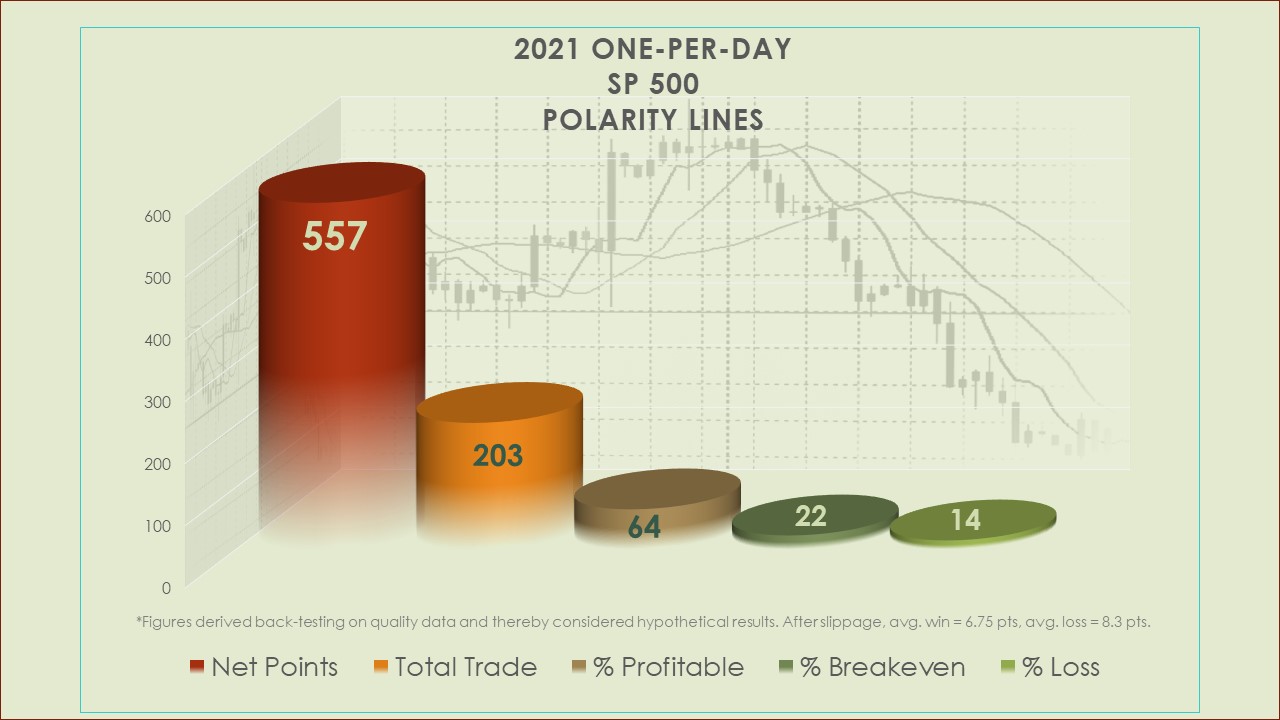
Have you ever seen markets run up or down into an invisible wall? You try in vain to explain the invisible anomaly with a pivot point, moving average, or price support. And once price breaks through, it explodes like a rocket. Chances are You have encountered a “polarity line,” or one of W.D. Gann’s “resistance lines.” The catch- these lines are only visible to the Gann trader. These lines represent hidden forces behind-the-scenes of the market. If a market has enough energy to close above or below a polarity line on the timeframe you are trading, the polarity propels price a predetermined distance. Gann advised simple, objective rules for trading these lines alone or with his other techniques. The placement of each line in advance changes each day, week, month, or year according to a predetermined formula. It is possible to draw lines are drawn YEARS in advance, even for intraday analysis. Trading these lines are ranked according to "best of breed" in our "W. D. GANN: MAGIC IN THE MARKETS" Training. Gann combined Polarity Lines with other Gann techniques and conventional technical analysis. The sky is the limit on their application, because they capture a sound premise causing breakouts. The graph to the right shows Facebook stock's weekly Polarity Line trades for all of 2021 using only the simple first break of the nearest line each week. A preschooler can do this. Of the 52 weeks there are 42 trades, 27 wins, 6 losses, 9 break-evens, and a net $74.40 points. Do you know of any quant programs that can do that? Using only the break of a drawn line? Last year FB printed over $75 dollars net up using just these line breaks. Over the last 4 years it usually does about $39 minimum. Let's up the ante a bit. In the graph below for the Weekly Polarity Lines on the SP 500, we have added the Arcana, or W. D. Gann's trend prediction technique as a directional trade filter. The graph breaks down the trading 3 ways: (1) Only taking the first break of the nearest line to price limited to one trade per week; (2) Dividing the week into zones based on Arcana trends or trendless zones, and taking only the first line break of each zone only in the direction of Arcana trend; and (3) Same as #2 above but taking only the first 2 line breaks in each trend zone. Gann offered options like these to his students based on their appetite for complexity. Note that each "win" in the graph represents 14.25 points on the SP 500 after slippage applied to diminish each win and exaggerate each loss and breakeven. By taking only one line break alone per week, these Polarity Lines have yielded between 90 and 220 points each year on the weekly SP 500 for the past 6 years, but as you can see they are far more potent adding Gann's Arcana as a trade filter. Of course, these lines also work on an intraday basis. Slippage is more of a factor on intraday markets using these lines. The key is to find a very liquid and active market to compensate, usually a stock. Click on the graphs below to see expanded results and test criteria on intraday performance on the SP 500. Check out gold weekly futures polarity lines below. This technique and data set is confined to New York equities session. Only 3 losses in all of 2021! Each target and stop is approximately $10. Executable on GLD etf and options as well as futures. Contact us for more information about the above techniques, or if you would like stats on the market and timeframe you trade.
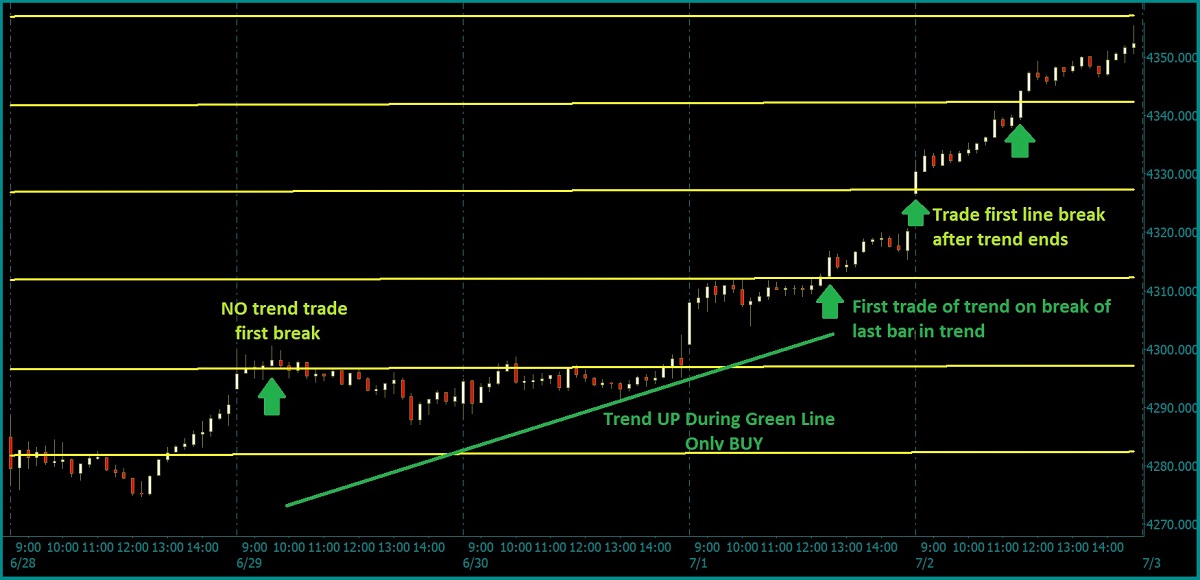
FACEBOOK WEEKLY POLARITY LINES
SP 500 INDEX & ES FUTURES WEEKLY POLARITY LINES
GOLD FUTURES WEEKLY POLARITY LINES
UPCOMING EVENTS...
EMPIRE NEWLSETTER 2022 FORECAST
March 2022Magic In The Markets Training
August 5th, ONLINEDISCLAIMER
Futures, Equities, and Options trading/investing has large potential rewards, but also large potential risk and is not suitable for everyone. You must be aware of the risks and be willing to accept them in order to invest in the equities, futures and options markets. Do not trade with money you can’t afford to lose. This is neither a solicitation nor an offer to Buy/Sell futures, stocks or options on the same. No representation is being made that any account will or is likely to achieve profits or losses similar to those W. D. Gann claimed or anything shown on this website. The past performance of any trading method, strategy, or technical analysis technique, system or methodology is not necessarily indicative of future results. No one associated with this seminar or Tradingwdgann.com are Registered Investment Advisors, Commodity Trading Advisors, or certified, registered, affiliated or approved in in any way with either the National Futures Association, Securities and Exchange Commission, Commodities Futures Trading Commission, or any other organization.
The “Magic In The Markets” course exegetes and replicates, as accurately as possible, the original technical analysis, strategies, and market techniques of the late W.D. Gann; and not necessarily the exact trading methods of course presenter or any other individual or entity. You may not be able to duplicate the results of W.D. Gann for many reasons, including, but not limited to, skill of the individual and the changes in financial markets since Gann wrote about them. Recipients of this course receive hypothetical, back–tested data and not actual trading results. Technical analysis, indicators, strategies, and market techniques, including any descriptions or evaluations of their performance, included in this course and displayed on this website, are described and evaluated based on hypothetical back-testing, and not the actual trades or earnings of any individual or entity. Course includes far more applications to market instruments and time frames than the presenter can possibly implement. Course author & presenter has sources of income in addition to his work with financial markets. In any and all descriptions of this course, or any information displayed on this website, no individual or entity, including past clients or course presenter, “hold themselves out” as achieving any level of success trading or amassing any level of wealth or income derived from any course offered on this website or any or all of the information displayed on this website.
“Magic In The Markets” teaches the individual technical analysis, market methods, strategies, and indicators we believe W. D. Gann used in financial markets, occasionally demonstrated by showing different ways Gann combined them to work together. Neither These combinations, nor anything displayed on this website or offered in any course on this website constitute a “futures trading system” or a “stock trading system.” Nothing shown or described on this website should be taken as any individual or entity claiming, inferring, or insinuating, investment advice in any way. No one associated with course or this website accurately verifies or tracks results of past clients.
CFTC RULE 4.41HYPOTHETICAL OR SIMULATED PERFORMANCE RESULTS HAVE CERTAIN LIMITATIONS. UNLIKE AN ACTUAL PERFORMANCE RECORD, SIMULATED RESULTS DO NOT REPRESENT ACTUAL TRADING. ALSO, SINCE THE TRADES HAVE NOT BEEN EXECUTED, THE RESULTS MAY HAVE UNDER-OR-OVER COMPENSATED FOR THE IMPACT, IF ANY, OF CERTAIN MARKET FACTORS, SUCH AS LACK OF LIQUIDITY. SIMULATED TRADING PROGRAMS IN GENERAL ARE ALSO SUBJECT TO THE FACT THAT THEY ARE DESIGNED WITH THE BENEFIT OF HINDSIGHT. NO REPRESENTATION IS BEING MADE THAT ANY ACCOUNT WILL OR IS LIKELY TO ACHIEVE PROFIT OR LOSSES SIMILAR TO THOSE SHOWN.