W. D. GANN FORECASTING
Forecasting the markets is another trademark of the legendary trader W. D. Gann. We still have several of Gann's annual forecasts from his newsletters to longer-term investors. Most are remarkably accurate.
Some years, like 1951, failed to materialize. but Gann advertised a success rate of 85%. He always let the market confirm his forecasts and traded them using other tools, using the forecast as a guide once the market confirmed.
Today we find the same statistic of 85% playing out in these forecasts. I'll take it! Few people realize that W. D. Gann forecasted more than one time frame. On the US Indexes, the strongest, most exact, and most consistent forecast was the RG7 (from Robert Gordon's 7 days) forecast, which lasted about 2 years. The annual forecasts are the bread and butter of the Gann forecaster. Gann forecasts also apply to intraday and weekly timeframes too.
Like W. D. Gann, we specialize in forecasting the US Indexes, summarized by the SP 500. This forecast serves as the foundation for our Empire Market Letter. Before we get to the forecasts below, some interesting observations about how these forecasts work...
As W. D. Gann and Luther Jensen laid out in their writings, sudden, unexpected news always interrupts forecasts and cycles. Gann wrote a special chapter on elections unexpectedly altering forecasts in his book, 'The Truth Of The Stock Tape.' You can see that notated in the 2016 election of Trump in the charts below.
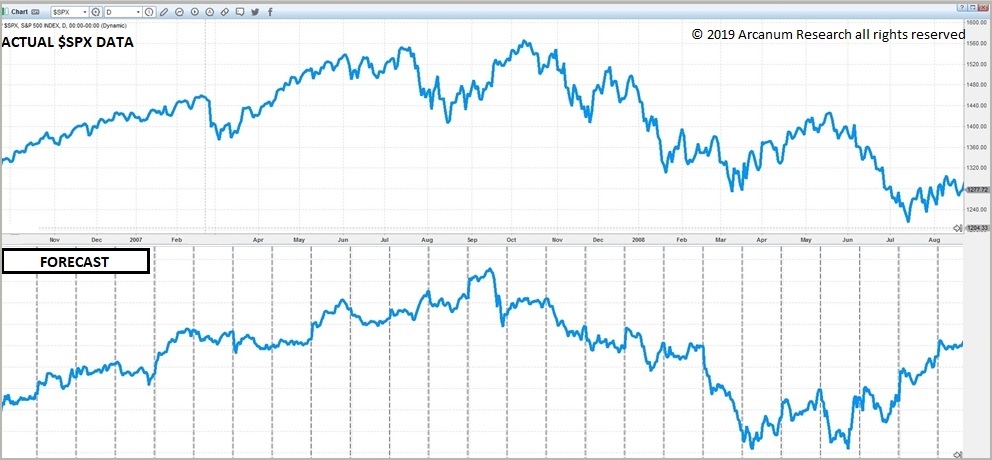
W. D. Gann forecasts are drawn and published before the market data for each period and never changed. Let's start with a gallery of our 2-year forecasts below. As you scroll through the gallery, each plate has the forecast at the bottom and the actual market data played out on top for the entire period. Years covered are labelled above charts. Special notes follow the gallery.
Just about all of the forecasts above were dead on. Except 2011- 2013, which was a complete inversion. We would label this a failure, but what is interesting is that all the failures are exact opposites like that, with the timing matching.
2015 sees a move against the trend without an apparent reason. The move is brief but sharp to the downside, before the market rejoins the forecast. We see the same thing from November 2018 - January 2019. We call this the "message to the FED." Where the big money moving the market tells the FED to omit raising rates, and shows them what will happen if they do. There are few other explanations for either move. And the FED apparently listens.
In the period 2015- 2017, we see the market perfectly acts out the forecast right up until the November 8th, 2016 election of Donald Trump. I believe that the down forecast from that point is telling you what the future would have been if someone else was elected. Read Gann's chapter on elections at the beginning of 'Truth Of The Stock Tape.'
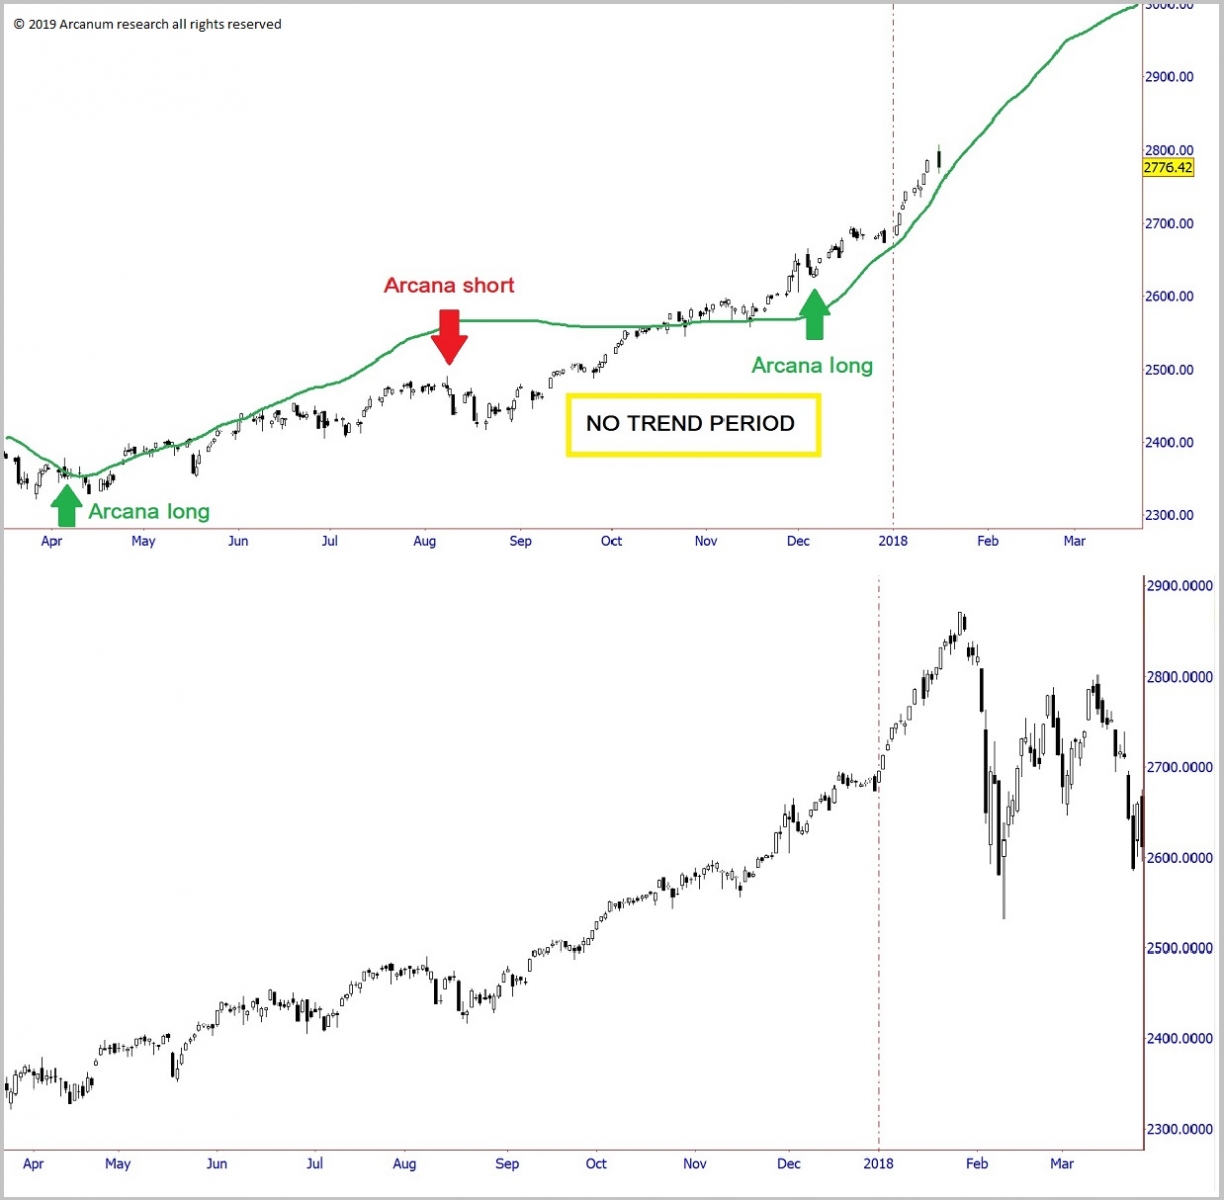
Now let's turn out attention to annual forecasts in the charts below. Using the same principles, scroll through the gallery below for annual forecasts against market data for the years 2017, 2018 on the US Indexes. The forecast line on the top plate of each chart was drawn before the year began and was never altered. The bottom plate of each chart is the actual market data of the SP 500 for each year. The forecasts runs from March 21st to March 21st of the next year. The green and red arrows are the Arcana trend direction and predictions, also drawn before the market data.
For both 2017 and 2018, the years concluded with big moves against the trend. Happening for no apparent reason, these moves are buyable. The market eventually catches up with the trend.
Finally, the forecasted December 2nd Arcana trend turning down was dead on. The market took off south, then paused and pulled back, then resumed down. The signaled entry on a simple trendline break was signaled by the red trendline broken. Even though this would have been a killer trade, we advised against it because of excessive volatility. After 4 great trades and 400+ points if these signals were followed, why risk. After all, prices were still above an up-sloping 50 month moving average.
Email us at empire@chicagodaytrading.com or call 312-532-2116 to signal your interest in Empire.


