GANN FOREX TRADING ON EURO
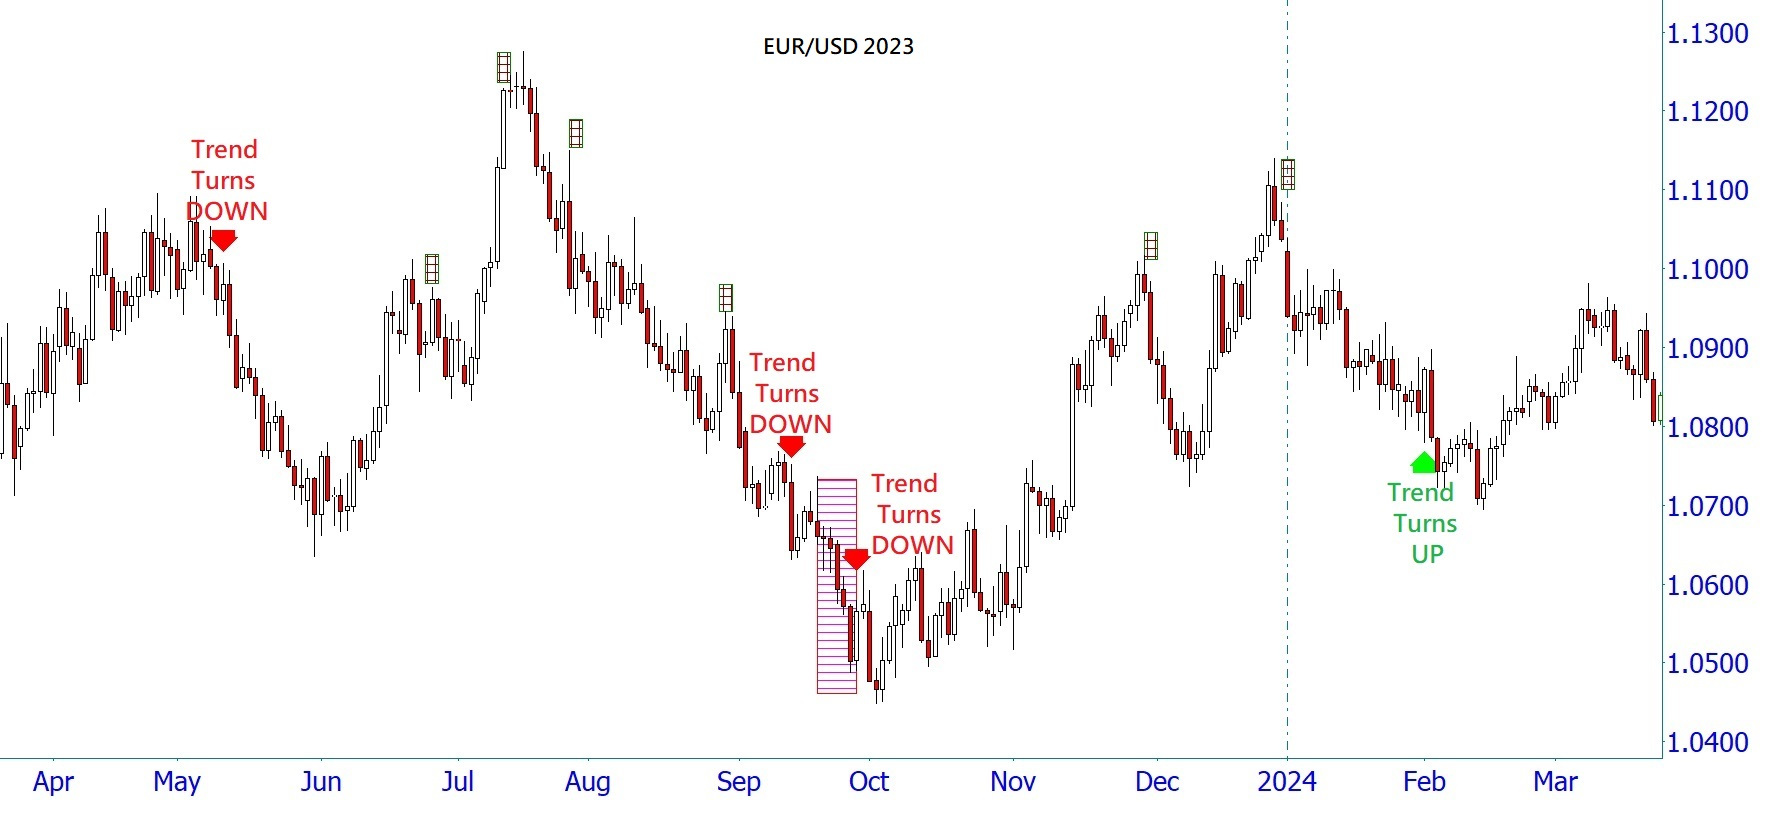
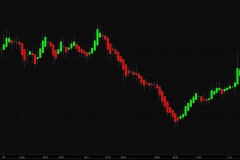
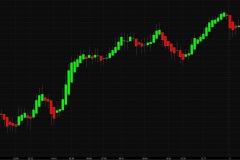
Our application of W. D. Gann's trading methods to Forex is most spectacular on the Euro daily chart. Forex trading began well after W. D. Gann passed away, so we lack the benefits of his writings about the Forex markets. Gann traded and wrote well before the existence of the European Union, so we are unable to even get information from him about European Union cycles. Finding the dominant cycle method on the Euro, as well as which of Gann's operating methods work best for this market, had to be done from the ground up. The 'sweet spot' for Gann's methods on the Euro is the daily bar timeframe. This timeframe yields the most points, best Reward/Risk, and the highest profitability. On the daily chart for the year, the dominant cycle in the Euro is Gann's Arcana trend cycle. The Arcana cycle serves as the backbone and framework for Gann's mathematical entry methods and money management. In the scroll-through gallery below, you will find the last 3 years of EUR/USD spot daily charts. Each year begins with a chart showing only the Arcana trend cycles, shown as direction trend zones via the large green or red arrows and labels. Next, a chart is added for the same year showing W. D. Gann's "balanced" entry techniques, only trading in the direction of the trend cycle and only trading in a period of active trend. The third chart for each same year shows entries and trades from Gann's "geometrical angles" in combination with a special square technique. These trades also only operate during active trend cycle legs. On the same chart you will find rarer "pullback" entry entries and trades. The "balanced entries" come from a technique Gann broke down in 'Truth of The Stock Tape.' Balanced entries were one of Gann's main entry methods, getting the trader in at the best price while at the same time involving market confirmation. The "geometrical angle" entries come from Gann's writing in his stock and commodity courses written toward the end of his life. Together with the pullback method, all 3 were designed to work off the same underlying Arcana framework. Each have their own money management system that varies based on price's position to the trend. As you can see, the results are pretty stunning. 38 total trades, yielding 32 winners, 5 break-evens, and 1 loss over three years.
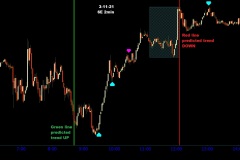
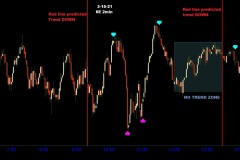
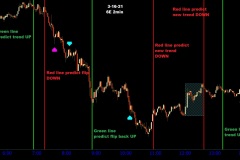
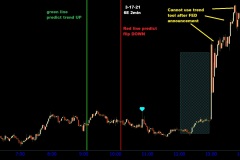
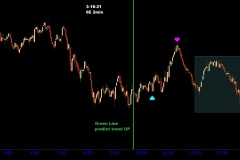
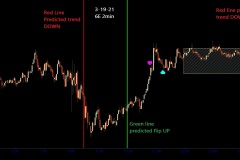
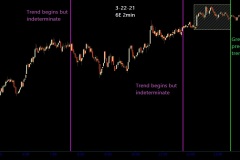
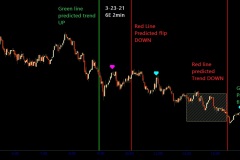
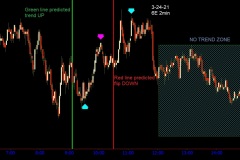
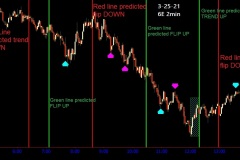
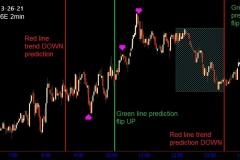
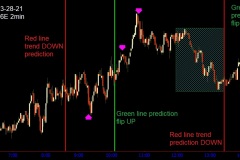
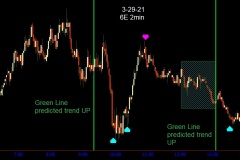
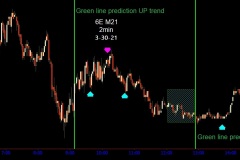
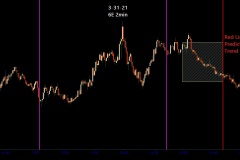
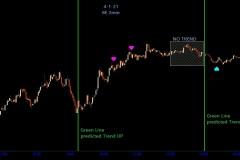
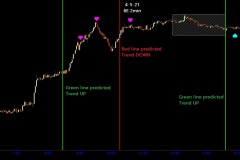
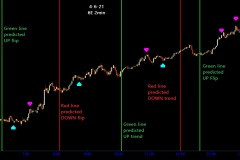
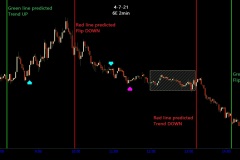
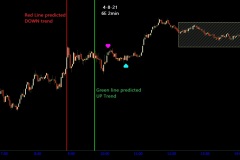
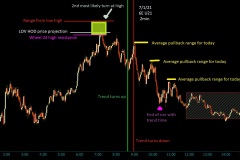
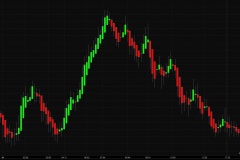
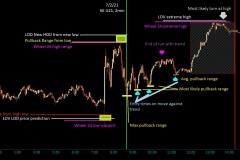
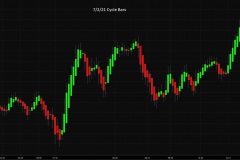
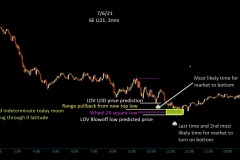
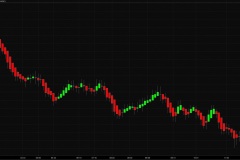
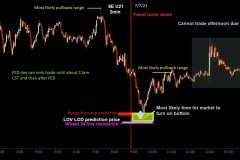
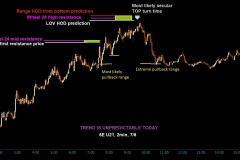
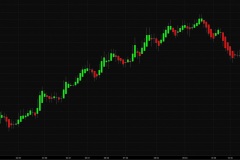
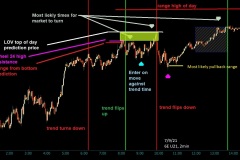
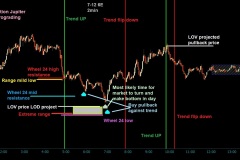
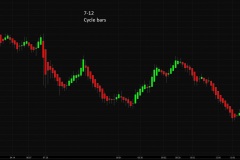
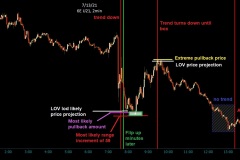
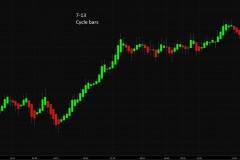
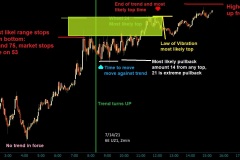
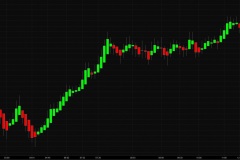
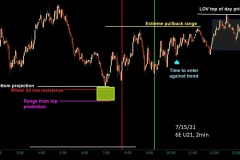
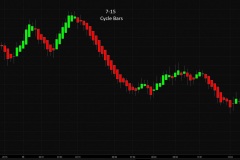
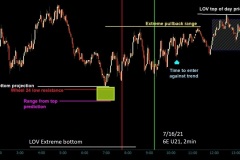
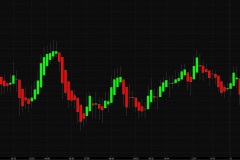
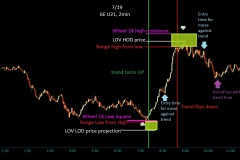
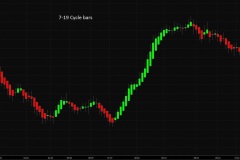
We worked up the galleries below for a Forex Trading Firm in 2021 who wanted to integrate Gann's trend, price, and time prediction into their own proprietary trading methods. You will see the intraday Arcana trend prediction applied to the Euro currency futures on 45 consecutive recent days using 2min charts. We displayed Arcana on the futures because the tails and the bars in spot forex or the Euro/Dollar pair can be a little distracting. But the data for the signal will be the same. The Intraday Arcana predicts precise trend direction and duration in advance on an intraday basis beginning at daybreak New York time. You can make the predictions days ahead of time, and it does not depend on market data. On our website, you will find the annual application of Arcana going back for the entire history of the Euro applied to the spot forex. Each Green or Red line below denotes the predicted beginning of a trend either up or down. Some of the lines labeled “flip” also start a trend up or down, but predict that trend as an opposite flip of the previous trend. The shaded area or box is a “no trend zone” where no trend exists in that time of day. the market is free to do as it pleases. The little blue arrows denote predicted ideal times for entries in the direction of the trend in case of a pullback against the trend. The little purple arrows denote ideal times for a market run in the direction of the trend to end or pause. They are not “buy on blue sell on purple” signals. The Arcana is not a trading system. It is a trend prediction system. Our test for it is simple. If the predicted trend is UP, then the market should make a move of substance in that direction AND close the trend leg out higher or even (within 3 pips here) at the end than the price was at the exact start of the trend. A trend can end with a flip or just end. The best way to use Arcana is as a “behind the scenes” roadmap of the day to come, pinpointing times when the market will have up or down energy, where those times will start, and the ideal times to enter or exit those trends. See below for July so far intraday price and time methods combined. The elements that W. D. Gann would have used on the chart would be dictated by the Arcana trend direction, even in no-trend periods. There are several price methods on the charts below. Gann used a trifecta confluence of Law of Vibration price prediction (used mainly for the main and extreme lows and highs of the day,) Wheel of 24 (confirmed highs and lows,) and range prediction from tops to bottom (locked in the area of price predictions for highs and lows.) Where these three came together, a lime price box of 2-3 ticks is drawn. Gann also predicted exact ranges for pullbacks, denoted by small yellow horizontal lines on the charts. W. D. Gann's time methods start with the trend, or red and green vertical lines on the charts. These lines mark exact times and durations where trend is UP OR DOWN. In some cases, these mark exact times where the trend will flip opposite. These indicators time the general UP or DOWN energy/trend of the market, to the minute. The small light blue arrows are "Minor Entries," or exact times to enter the market on a minor move against predicted trend direction. The small purple arrows mark the exact times that a move in the direction of predicted trend should die out. Finally, the grey/green arrows market exact 'secular' turns times that mark the most likely or second most likely time the market will make a top or bottom. These times are confirmed by the market making a new high or low into these times. After the chart with the time and price methods for each day, another chart of the same day shows Gann's vibrational time period for that day converted to cycle-bars measuring the mean and comparing it to the bars before. In this method combining price and time, the market will confirm each turn. This is shown on a separate chart to avoid confusion, but in live trading you would have both charts open. W. D. GANN EURO ARCANCA CYCLE TRADING
EURO INTRADAY TREND CYCLES; PRICE & TIME PREDICTION
INTRADAY PRICE AND TIME METHODS COMBINED

