CUSTOMIZED INDICATORS TUNED TO GANN CYCLES
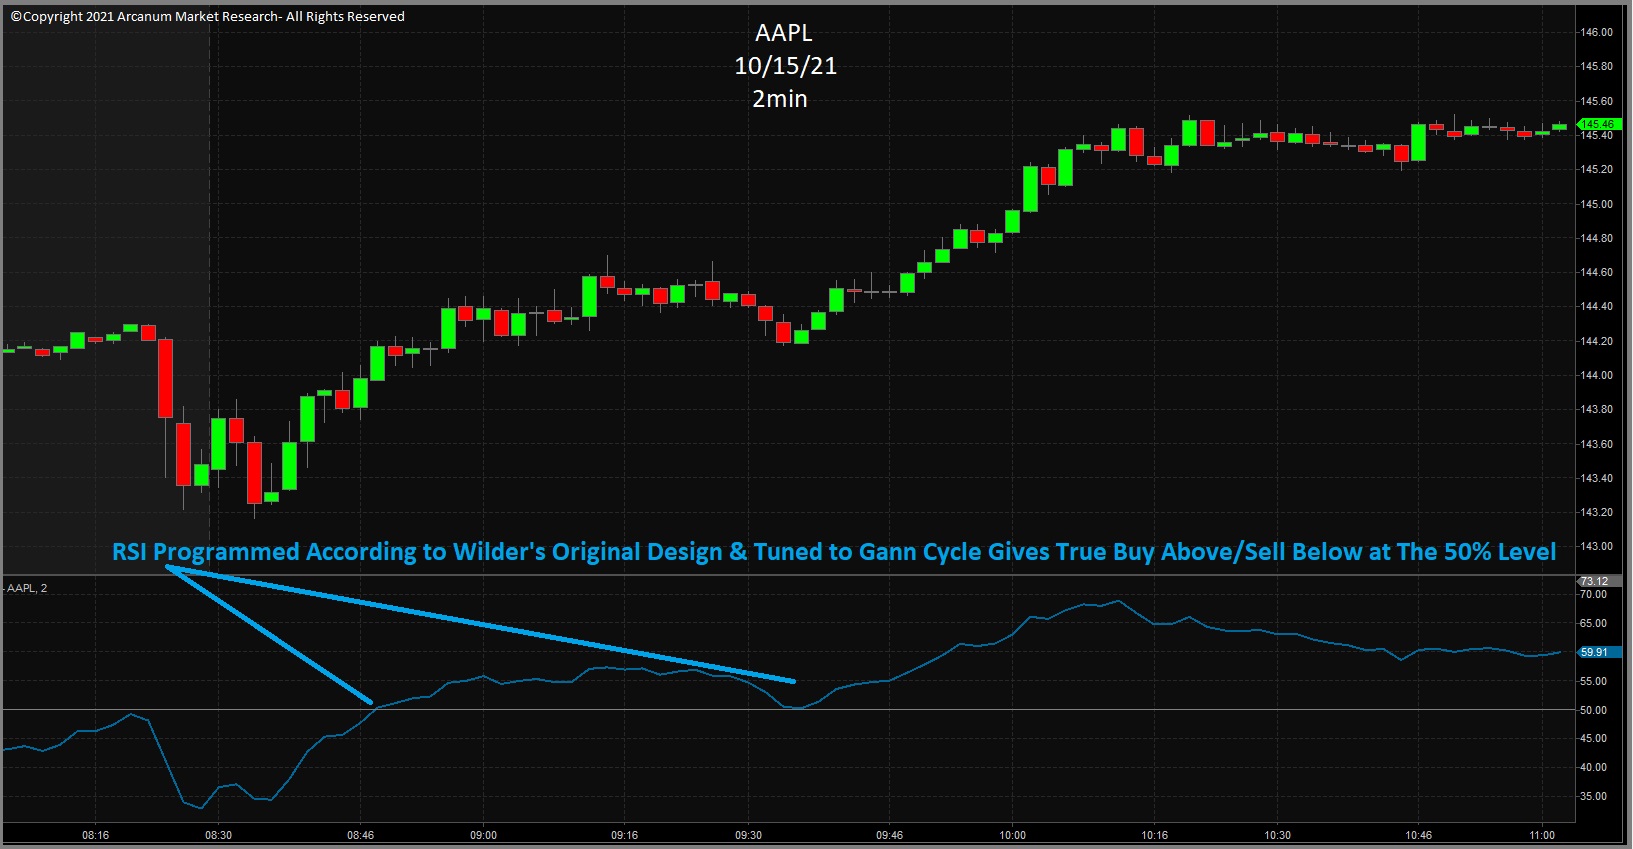
An indicator measures a function of your market over a specific time. Gann showed legendary market guru Wyckoff Sr. his entire system. Wyckoff thought Gann was a bit eccentric, with all the Astro and numerology. But Wyckoff knew that Gann was on to something big. Wyckoff he believed he could capture Gann's signals by math alone- using an "indicator." As Wyckoff became one of the founding fathers of modern-day market indicators, he did so with the awareness that the math behind the indicator would follow a certain cycle. Did you ever wonder why the number 14 has become a default for chart indicators on nearly every platform? Wyckoff designed his early indicator to measure the cycle of the moon, of which 14 days was half the length thereof. But Wyckoff never meant the moon cycle in that early indicator to be a universal. setting for every indicator. W. D. Gann used many cycles over different time frames, as well as ‘magic cycles’ that were constant and proprietary to each market. Click the above-left picture to expand. As a CMT, I customized this Williams %R so it functions closer to how it was originally designed. Then we tuned it to the Gann cycle on this day for the ES. The Willams %R measures trend in the middle, CCI on top finds oscillations against trend, RMI on bottom measures extremities of pullback against trend. All indicators have been smoothed and customized to lead instead of lag; and all have been tuned to this day's cycle of the SP 500. These exceptional indicators are only one small piece of the trading puzzle. See our newest line of complete Gann trading strategies. Click the picture at right to expand. We created our RSI to reflect Wilder's original formula and design. When smoothed according to Wilder's original formula and tuned to the Gann cycle for this day, the RSI truly allows you to "buy above, sell below" the 50% level- which was Wilder's main benchmark of strength. So no matter how good your indicator is at measuring a function of the market like trend, relative strength, or momentum; it will be inaccurate if it uses the wrong cycle. At Arcanum Market Research, we have combined the technical expertise of a CMT and the knowledge of Gann’s cycles to create what we believe to be superior indicators.
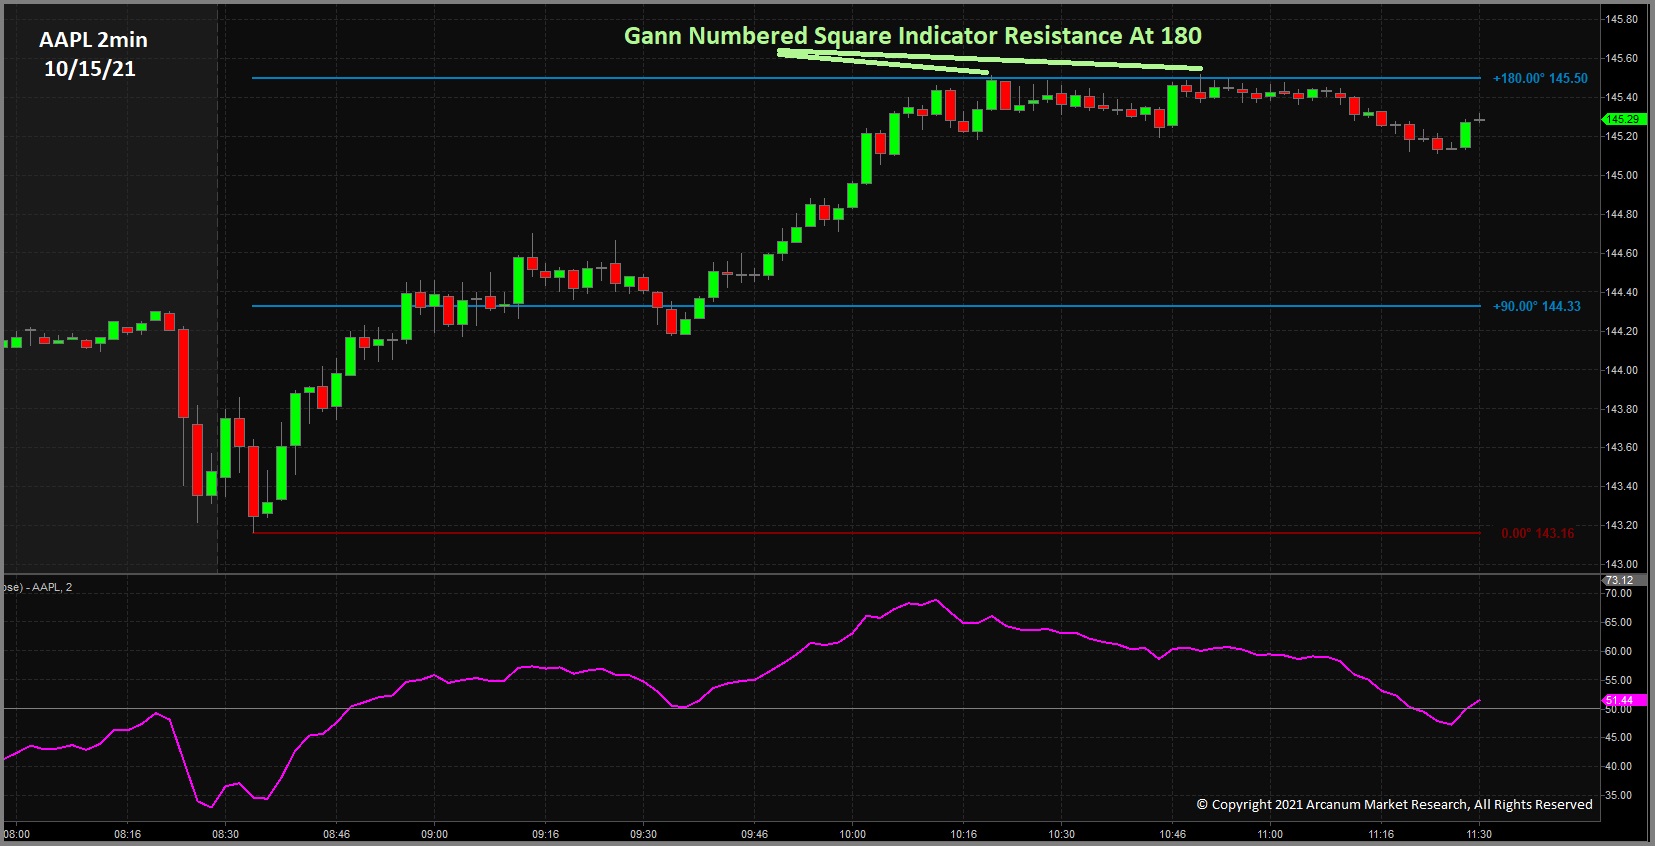
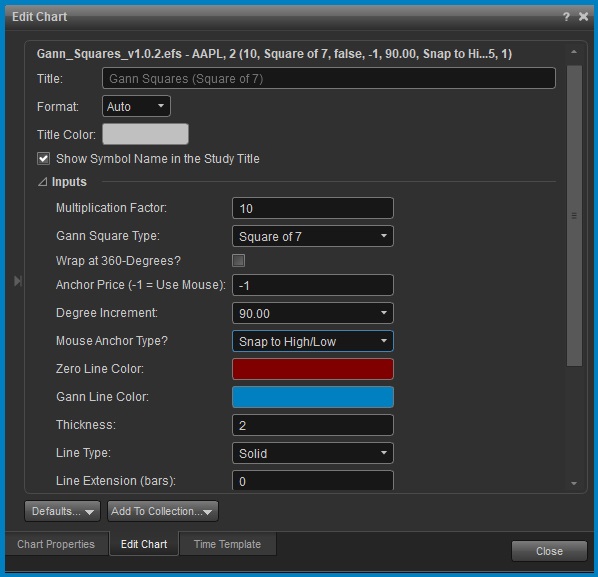
Why would we mess with conventional technical analysis at all when we have the unique trading methods and strategies of W. D. Gann? Because many of our institutional clients are unable to use anything with Astro or numerology due to mandates from investors or regulators. Schedule a LIVE DEMO to see a walk-through or customized Gann indicators, complete trading strategies, and back-testing stats. This foundational step is simple and should be taken by every serious market participant. Many modern market indicators aboard trading or analysis platforms have been corrupted from their original design. So we took a few of the very best indicators out there, investigated their origins and the intent of their creators, and reconstructed them according to their original formula and design. The most powerful step is then to use correct natural cycle of each market and timeframe. Only if you use the indicator as it is intended and tune it to the right cycle will the true trend, strength, or momentum of your market come to life on your screen. We include over 10 of these customized indicators and the knowledge of how to best use them in our "W. D. GANN: MAGIC IN THE MARKETS" Training. Click the above picture of our "Gann Numbered Squares" Indicator to expand. This "numbered Squares" Indicator below is our creation from the ground up. It plots the degrees of the numbered squares 1-12 onto any market chart and timeframe. The secret to using this indicator as Gann used it means knowing the right square to apply to each market, as that changes each day. You also must know the custom multiplier that converts degrees to your timeframe. In this way you can accurately change time to price. See below for a glimpse of the customization module. This approach is the cornerstone of Gann's high-performance 'Unicorn' intraday SP 500 strategy. 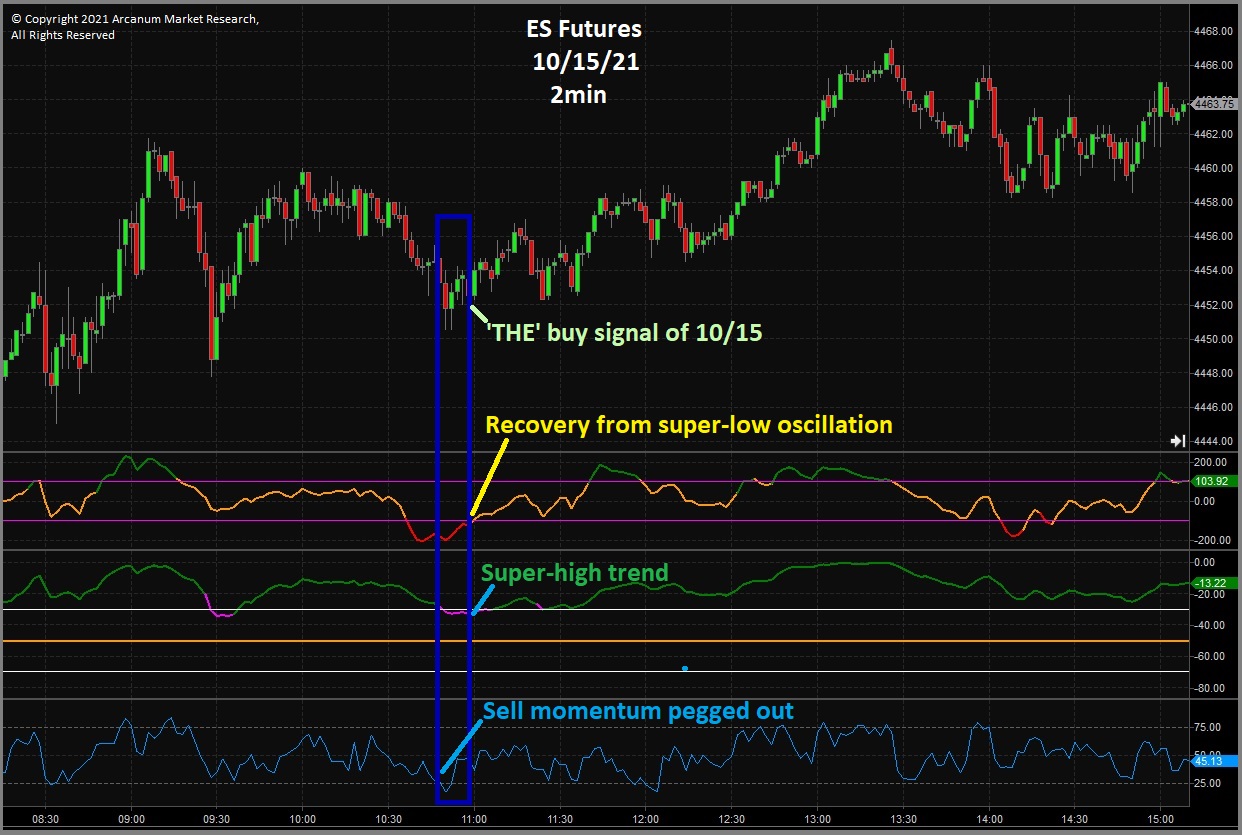
TUNING TO CYCLES RESTORES INDICATOR FUNCTION
CUSTOMIZED, TUNED INDICATORS TELL THE MARKET'S STORY