EMPIRE MARKET NEWSLETTER
Welcome to “Empire,” our market forecast letter based on W. D. Gann’s annual forecasting method. This newsletter blends Gann's unique method of forecasting the annual pattern of the market for the upcoming year with our own proprietary analysis of the economy and US Equity Indexes by a CMT. Empire 2022 edition is now available! See below for the review of the 2022-23 forecast so far as well as previous year's forecasts.
Empire is available for subscription on a case-by-case basis to those with “accredited investor” status. The annual forecast uses the SP 500 because the US Cycle is the strongest in the world. The forecast and accompanying analysis is geared to helping market professionals, analysts, and institutions, find more ideal times of the year to enter, exit, overweight/underweight, hedge, and rotate sectors around the annual forecast in US Equity Indexes.
Empire 2024-25, including the W. D. Annual Forecast until March 21st of 2025, is now available for subscription! Email us at empire@tradingqwdgann.com or call 312-532-2116 to signal your interest in Empire.
The annual forecast begins from March 21st of each year. Subscriptions to Empire are best purchased close to that March 21st window. See last year's entire 2022-23 Empire Letter, containing all pricing, by the teal link above.
2023-24 W. D. GANN ANNUAL FORECAST UPDATE
The W. D. Gann forecast below was released in March of 2023, and forecasted the year running from March 21st of 2023 through March 21st of 2024. Our forecasting blends Gann’s “Curve #1” and “Curve #2” methods used in his market letters with the trend direction and duration prediction of the Arcana. Besides the overall direction and curve of the market for each year, we can then get specific enough to predict isolated times when the market would trend, stop, chop, top, and bottom.
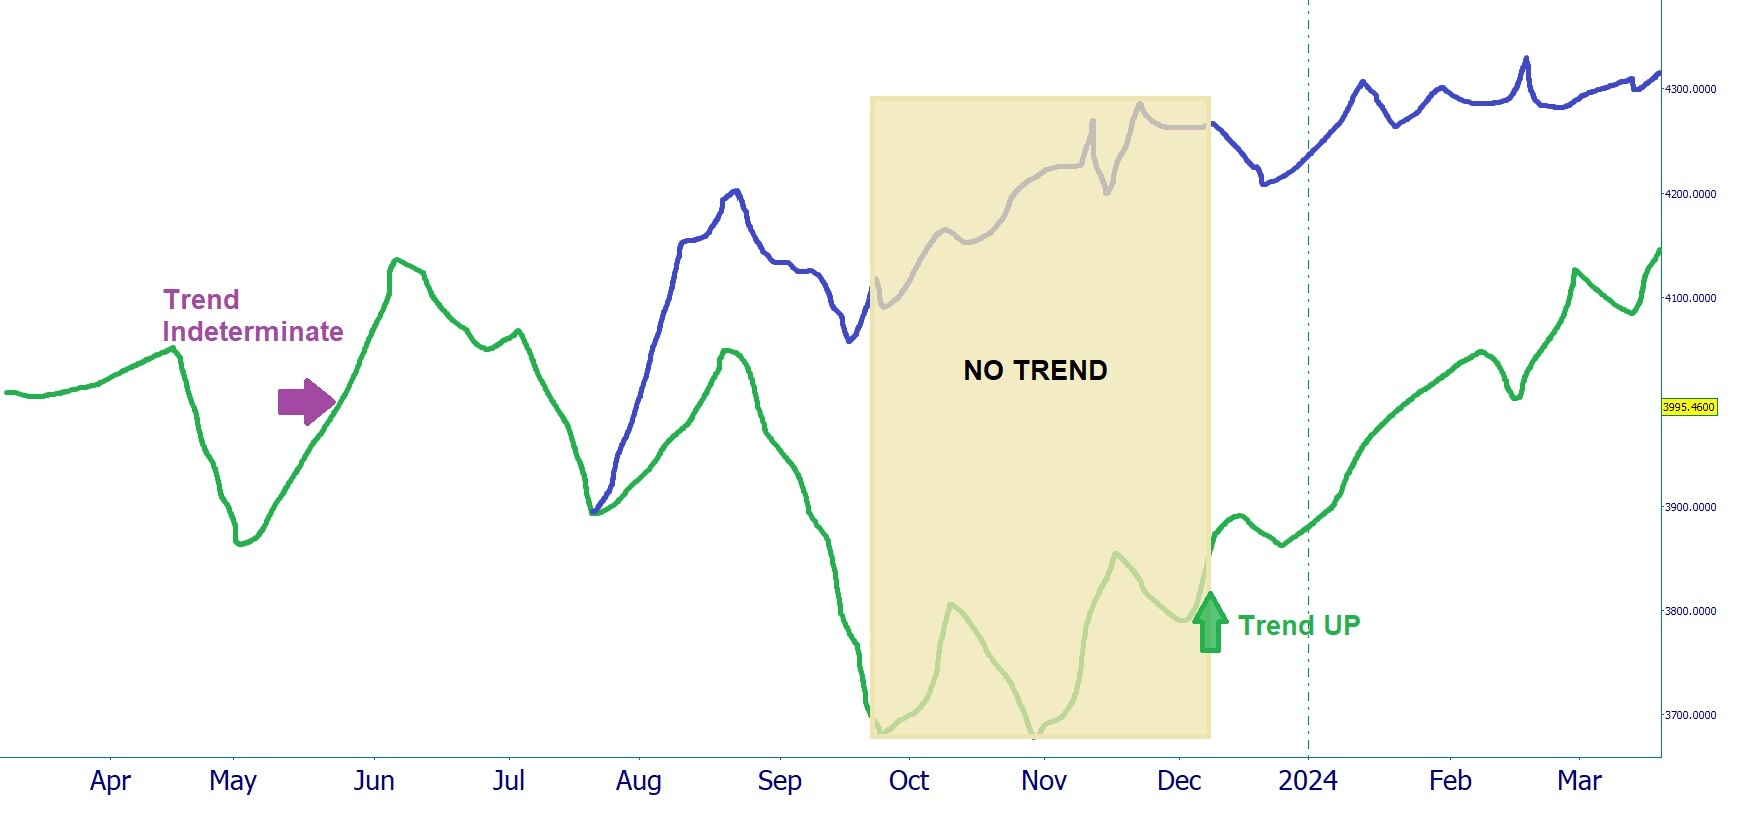
2023-24 is another forecast where Gann's curves #1 and #2 only partially agree. The two curves agree perfectly until in mid-July and then split. Both curves turn UP in mid-July, so the forecast remained unified in that regard. But the magnitude of the blue line goes on to make new highs, which the market followed. So we are locked onto the blue-line forecast for the remained of the year.
The Arcana trend prediction in mid-May was indeterminate (PURPLE arrow). This means that the forecast line was to be followed independent of the Arcana, and that we are less confident in up-moves or their endurance. But now the trend has proved itself UP.
With the forecast locked onto the blue line, this end-of-September pullback low was tracking right on the money. As the actual market low October was somewhat higher than the forecast began, it rightly played out as a pullback. The forecast indicated this low was the time to buy, whichever line the market grabbed onto, with the actual low being a few days late in October instead of September.
After the predicted end-of-September low, a new Arcana UP-trend began the first week of December. This date through April 2024 was the zone with the highest confidence to go long.
Read the detailed forecast reviews below from past years to see how "Empire" will enable you to integrate the secret direction of the market into your trading or analysis plan. Reach us to subscribe at empire@tradingwdgann.com or call 312-532-2116.
2022-23 W. D. GANN ANNUAL FORECAST
The W. D. Gann forecast below was released in March of 2022, and forecasted the year running from March 21st of 2022 through March 21st of 2023. Our forecasting blends Gann’s “Curve #1” and “Curve #2” methods used in his market letters with the trend direction and duration prediction of the Arcana. Besides the overall direction and curve of the market for each year, we can then get specific enough to predict isolated times when the market would trend, stop, chop, top, and bottom.
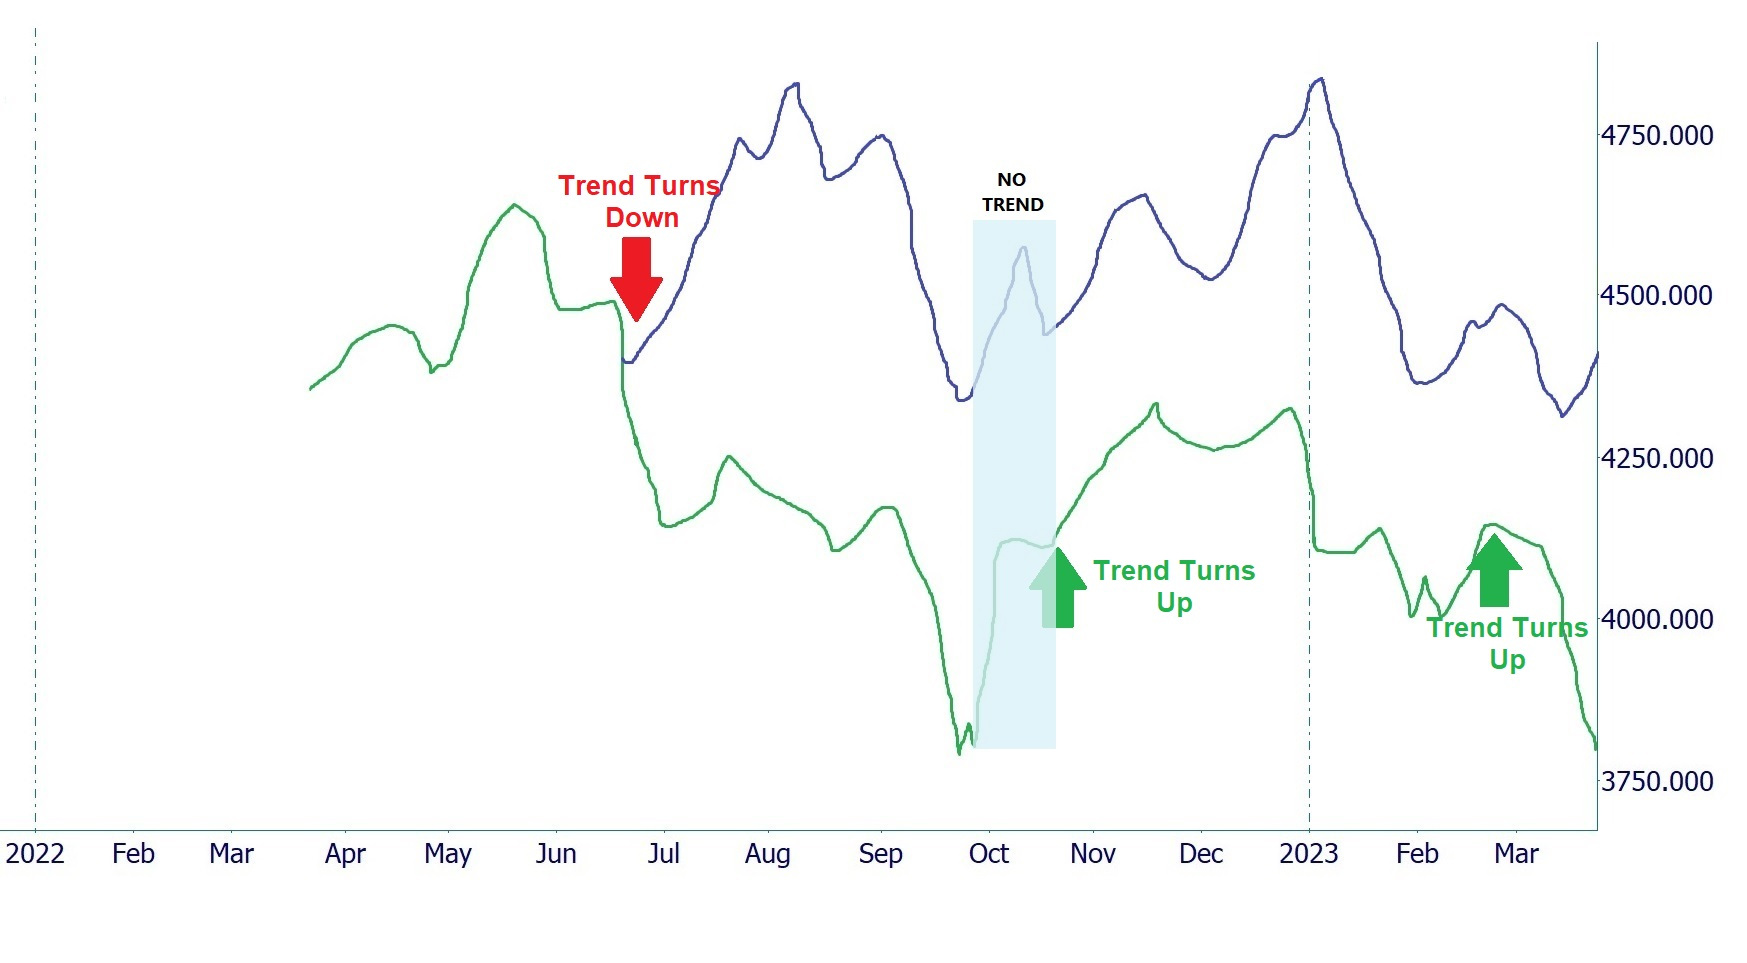
The 2022-23 forecast was dead-on as you can see. Gann's two curves (green and blue lines) forecast agreement until mid-June. Then they both diverged. When this occurs, you must wait until the market picks one, then it will stay with that line for the remainder of the forecast.
The market made it clear around June that it chose the green line. This enabled us to advise our subscribers and clients to short the 2-month rally that ended in mid-August, hit the bottom dead-on, and enter the rally that followed.
Our real-time commentary that accompanies the newsletter advised that the second up-trend around the end of October would produce a shallow-pitched incline full of chop. It would be full of gaps and give and take. This was again dead-on!
2021-22 W. D. GANN ANNUAL FORECAST
See below for review of past years' forecasts, beginning with last year's 2021-22 W. D. Gann Annual Forecast.
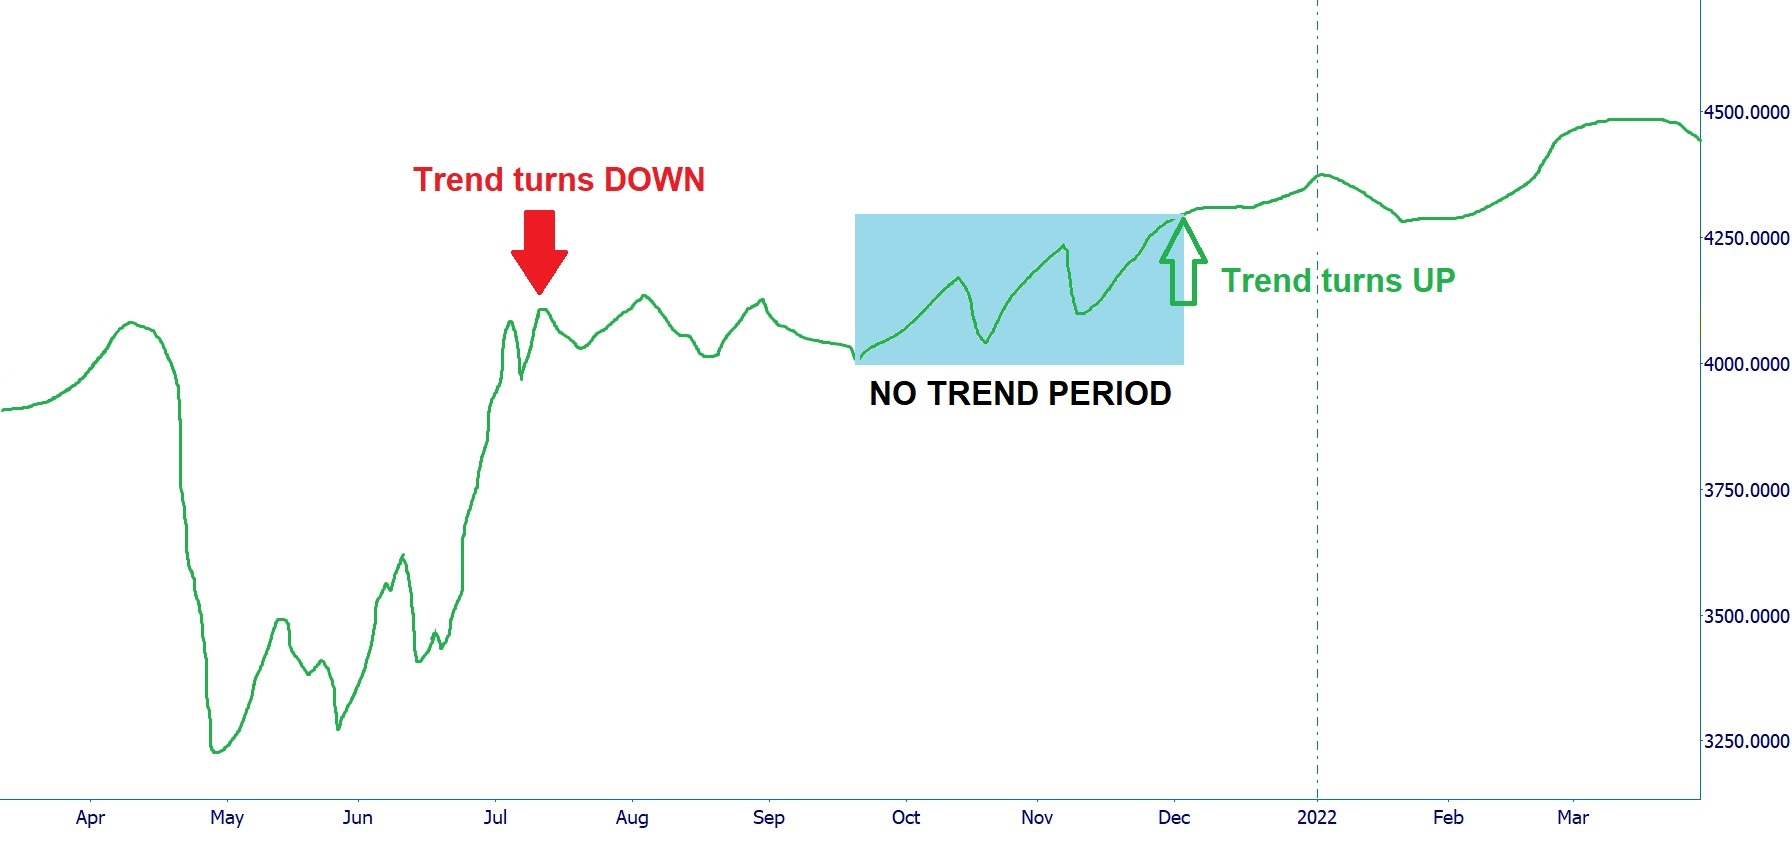
Gann's 2021 forecast first showed a buyable dip in May, then up to highs again. We allowed for a larger dip than transpired (barely 5%.) Next was a run up into new highs into the "Arcana" trend direction turning down July 14th. This down energy flew in the face of an up-forecast, so the result predicted a mixed bag, with chop accompanied by some new highs. At the end of September, the down energy ends, and the trendless market chopped higher, exactly as the forecast line predicted.
The onset of December saw a new "Arcana" UP-trend take over. The forecast called for a renewed UP-move, as the new UP-trend matched the rising forecast line. Then there appeared to be a buyable dip into February 1st, after which the final UP move would follow.
The Russian buildup and invasion of Ukraine intervened and pushed the market back down to end the forecast. But our forecast called for a rise of at least 15% in the SP 500 year-on-year from March 21st through March 21st. It was dead on again, with the peak gain coming January 4th at nearly 20%, and closing March 21st, 2022, with one year gain of 12.5%. In terms of magnitude and pattern, another extremely accurate forecast.
The complete 2021 Empire Forecast Letter will be available for review by April 6th. Order yours by clicking one of the above teal links.
2020 W. D. GANN ANNUAL FORECAST UPDATE
The W. D. Gann forecast below was released in March of 2020, and forecasted the year running from March of 2020 through March 21 of 2021. Just as Gann did in his original method, Gann, our forecasting blends Gann’s “Curve #1” and “Curve #2” methods with the trend direction and duration prediction of the Arcana. Besides the overall direction and curve of the market for each year, we can then get specific enough to predict isolated times when the market would trend, stop, chop, top, and bottom.
Empire also includes our unique slice of economic data that ranks the confidence of each year's forecast. Real time updates are provided prior to each month for polarity breakout levels and turn time in the full edition. Money management alerts are issued to follow polarity line entries, trades based on other unique events, and Gann analysis around these unique occurrences in the market like the ones we have just seen in March 2020.
Empire subscribers could see the market from late March to May coming. Thanks to Empire, they also see what is coming next, and also have a confidence level in the timing. Are you confident about what the markets will do next in 2020?
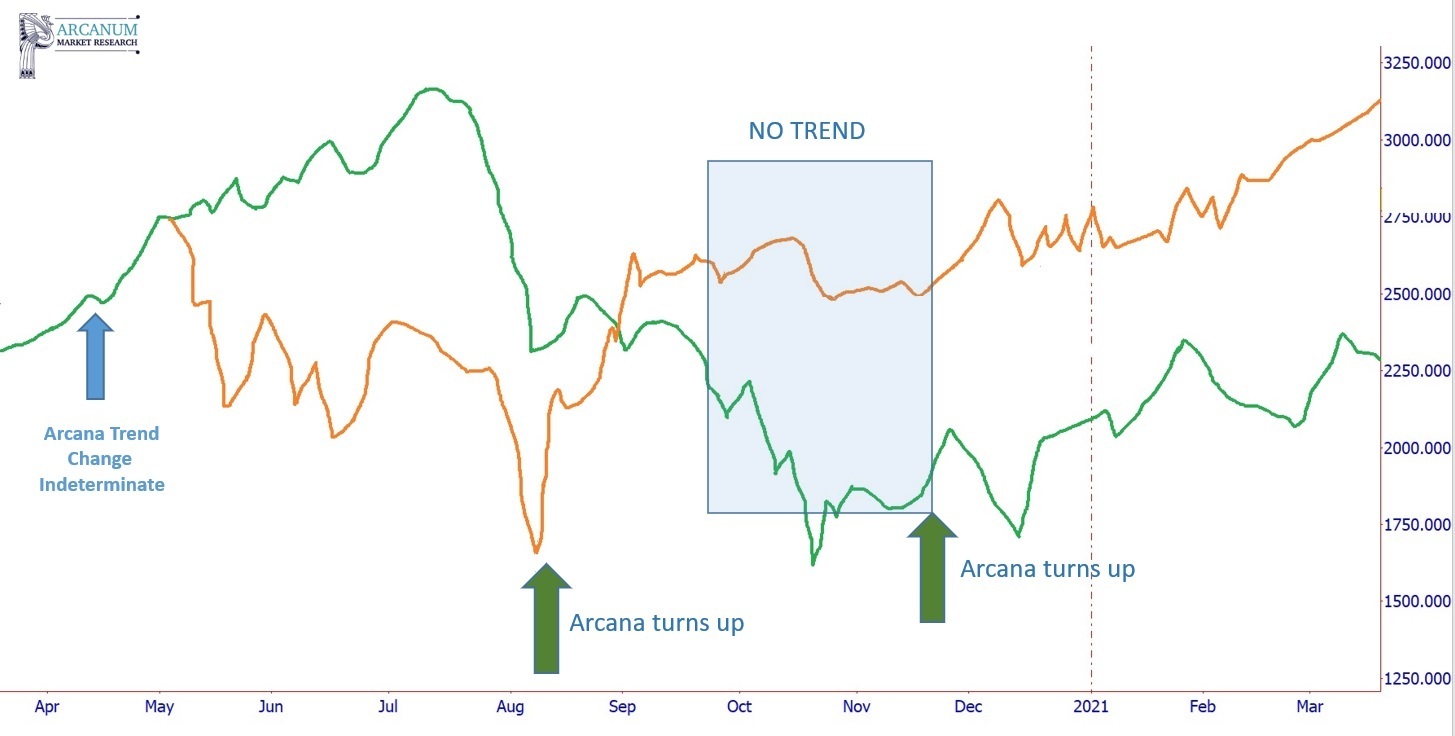
Our Empire 2020 forecast came out in early March 2020. We then went about an update on March 21st to reflect an accurate starting price given the COVID-19 slide. The annual W. D. Gann forecasts US Indices for March 21st, 2020 through March 21st, 2021. Below we can only display the update to January 15th due to respect for our subscribers. Dead on. See forecast and read description below it.
The forecast for 2020 was another instance where W. D. Gann's Curve #1 (green line above) and Curve #2 (orange line above) did not completely match. Gann illustrated these curves separately when they disagreed in his famous 1929 "Supply & Demand" Newsletter. By March 21st, we have confidence the market is bouncing into April 8th. Both curves agree up to that point. Then they fork- human choice will take us on one road. By May 5th, we are certain we are on the high road. The market will follow the green line curve until March 2021.
The market did as the green line forecast, soaring into the end of July. At that point we recommended all positions relating to US Indexes underweight or flat (if possible) due to the forecasted decline into the August 7th bottom/UP Arcana. That decline failed to materialize and instead paused.
Then we forecast an "UP" segment again starting August 7th through the end of the trend late September. A "no trend void" where anything can happen then Began, running through the election. The market complied. The we issued another up-turn November 28th through the end of what we can display above, with 15% rise possible. Again the market neatly complied.
2020 has been an accurate forecast, especially taking into account an indeterminate Arcana to start and Curve #1 and Curve #2 disagreeing. 2020 is a perfect example of how W. D. Gann interacted with his subscribers regarding a difficult forecast. He would focus on taking action during the points most certain and advise caution during those times that were inharmonious or vague.
2019 W. D. GANN ANNUAL FORECAST UPDATE
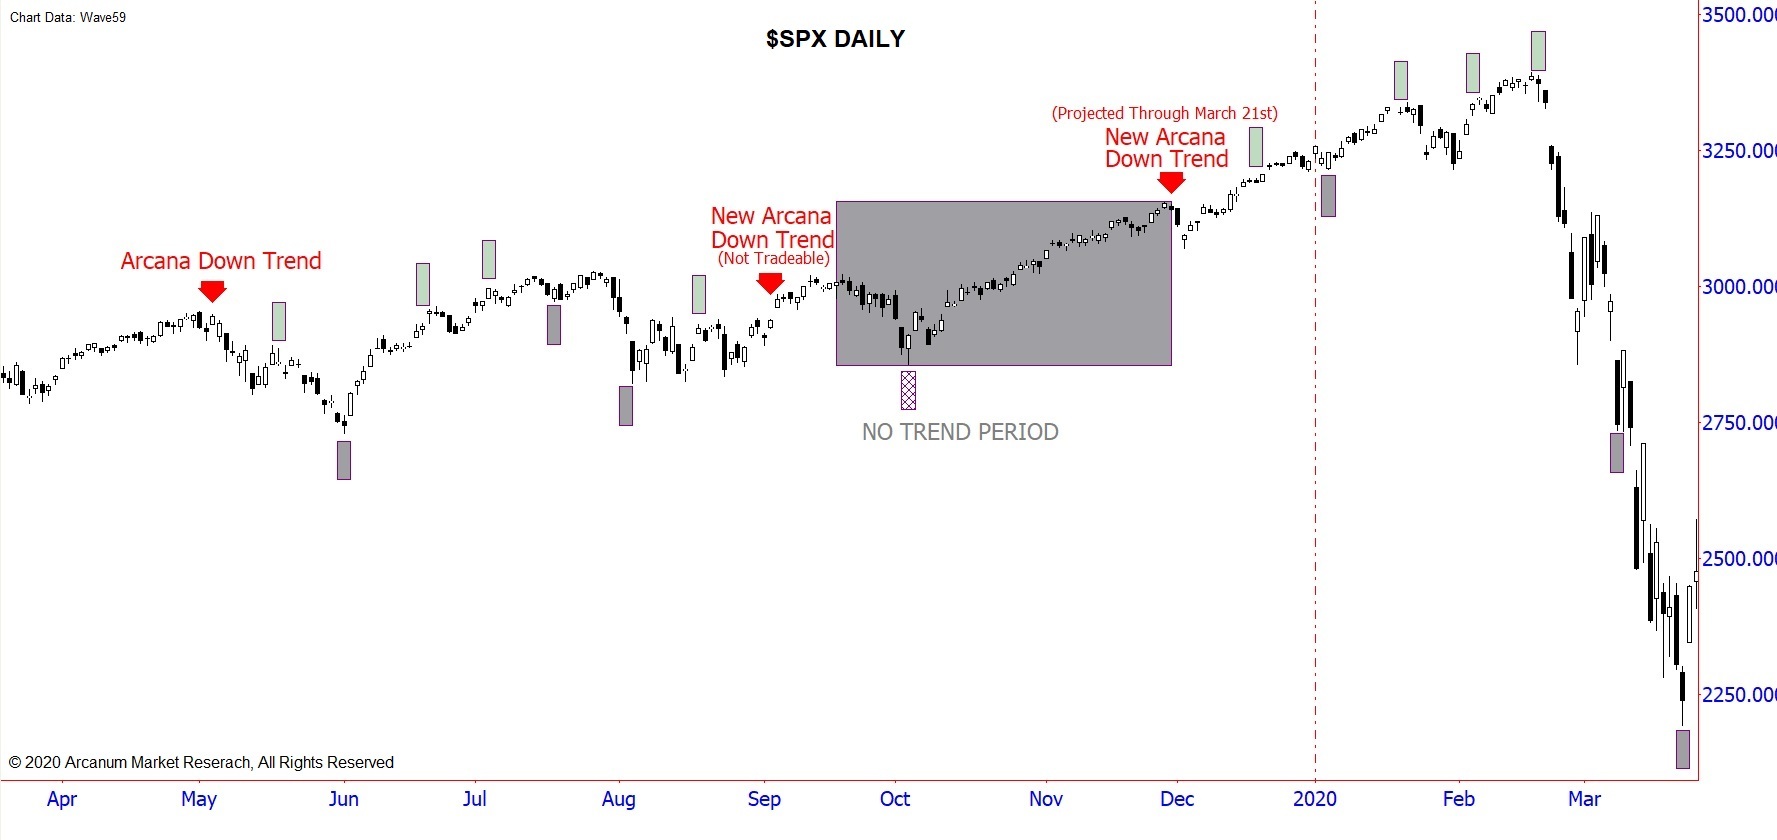
Our 2019 Empire Market Letter and Forecast was released in February 2019, prior to that year's market action. Though the pitch of the actual 2019 data is distorted by the cataclysm at year's end, as you can see the forecast below was dead-on for 2019, minus the apocalypse at the end. See below for explanation.
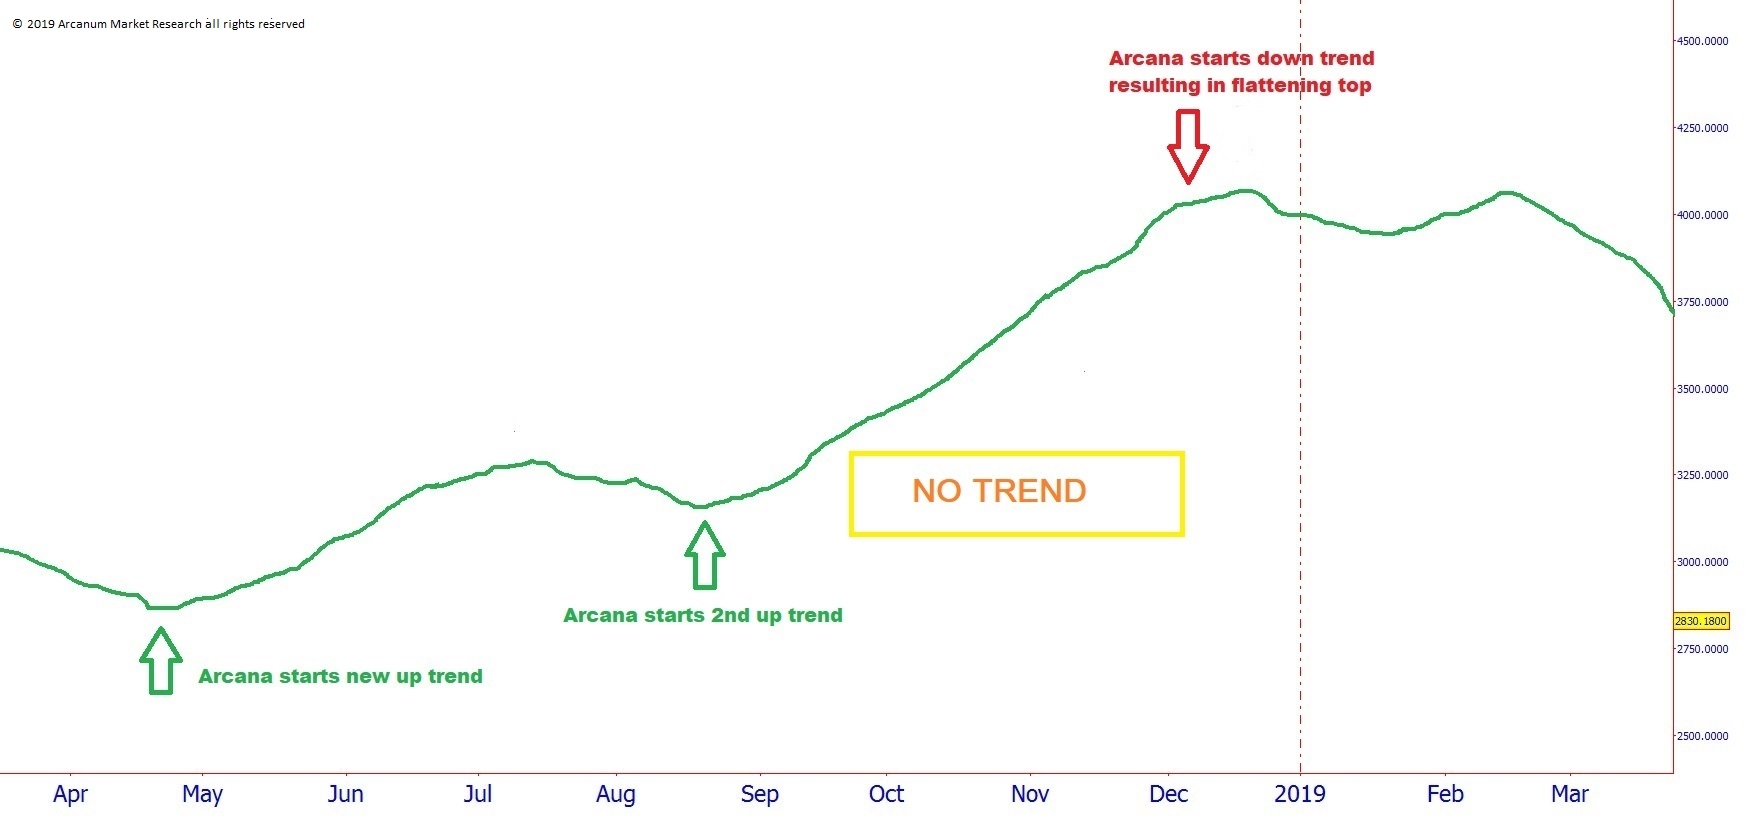
In the picture above, the 2019 W. D. Gann Annual Forecast Line is top, and actual SP 500 data on bottom. 2019 again posed a split in W. D. Gann's "Curve #1" and "Curve #2." The split comes where the blue line appears. This split denotes that human choice will make the market follow one of two paths for the year. Until then, the forecast is united. At the time of the split, we advised "out all annual positions."
Early on around May 2nd, the prediction in advance for both the forecast line and Arcana: a strong down. Shown the following plate, a Minor Arcana entry (pale green pillar, trend resumes) signals entry soon after. The short went against the secular uptrend though, and we near hit the bottom of that move to the day. Then a big bounce up against the down-energy of the Arcana. Then a brief Arcana trend down mid-August, also fighting the secular uptrend.
This mini-trend spans until September 23rd, then the "no trade zone" until the end of November. This small trend was not long enough to trade, and the message to our clients at this point: "out all annual positions" until the market confirmed the higher line in October. Then the market pokes higher than our projected double-top at this second shallow downturn, but the forecast got the pattern right. At this point we knew and advised the market would break to new highs at year's end and on through the end of the 1st quarter 2020.
The upper forecast line forecast that the strong secular uptrend would blow-off high and rip right through the November 22nd Down Trend Arcana. So we had a clue the market would correct given the down energy. What followed was a surprise to us and many. Looks like it is difficult to fool mother nature, as the Down-Arcana through March 21st won.
In the ABOVE 2019 full forecast, the big red arrows are the start of Arcana trend predictions. All down. The first Arcana Trend on May 2nd runs through the beginning of the second Arcana Trend mid-August. Then the next down trend lasts through September 23rd, where the grey "trend void" box starts. In this box, the market is forecasted to do its own thing. Then on November 22nd, the next Arcana is down, at which point the market blows through to new highs. The pale green pillars are minor Arcana times, marking times to enter in trend direction. The gray pillars mark ends of runs in trend direction.
2018 EMPIRE EDITION & EXPLANATION
Our 2018 Empire forecast is featured in the first chart below via the forecast line. Keep in mind that this letter is issued in January, so we have to assume a start-price for the March 21st. forecast start at that time. The second chart below lacks the forecast line, but adds the specific entry points against the trend, polarity line entries on moves against the trend, Law of Vibration extreme price projection entries, and money management on entries. All W. D. Gann forecasting techniques.
The above chart forecasts the general curve of the market with the forecast line. This forecasting line is drawn and we publish it before March 21st of 2018. Once the forecast is made, it remains unchanged. The green and red arrows show when the Arcana trend forecast turns up or down. These points are forecast more than 1 year in advance, and we also publish them before March 2st, 2018. The forecast curve and general direction turn out accurate for the year. The Arcana trend directions and durations strike us as uncannily accurate, as they are every year. Note the “trend void" September 23rd through December 2nd when the market went crazy.
Our opinion is that the bizarre drops of 2015 and 2018 where the market moved against the predicted trend seem to be ploys by those in control of the markets. They want to send the FED a message. That message? Raise rates, here is what will happen to you! And the FED listens both times. In both years the market snaps right back up to the forecast.
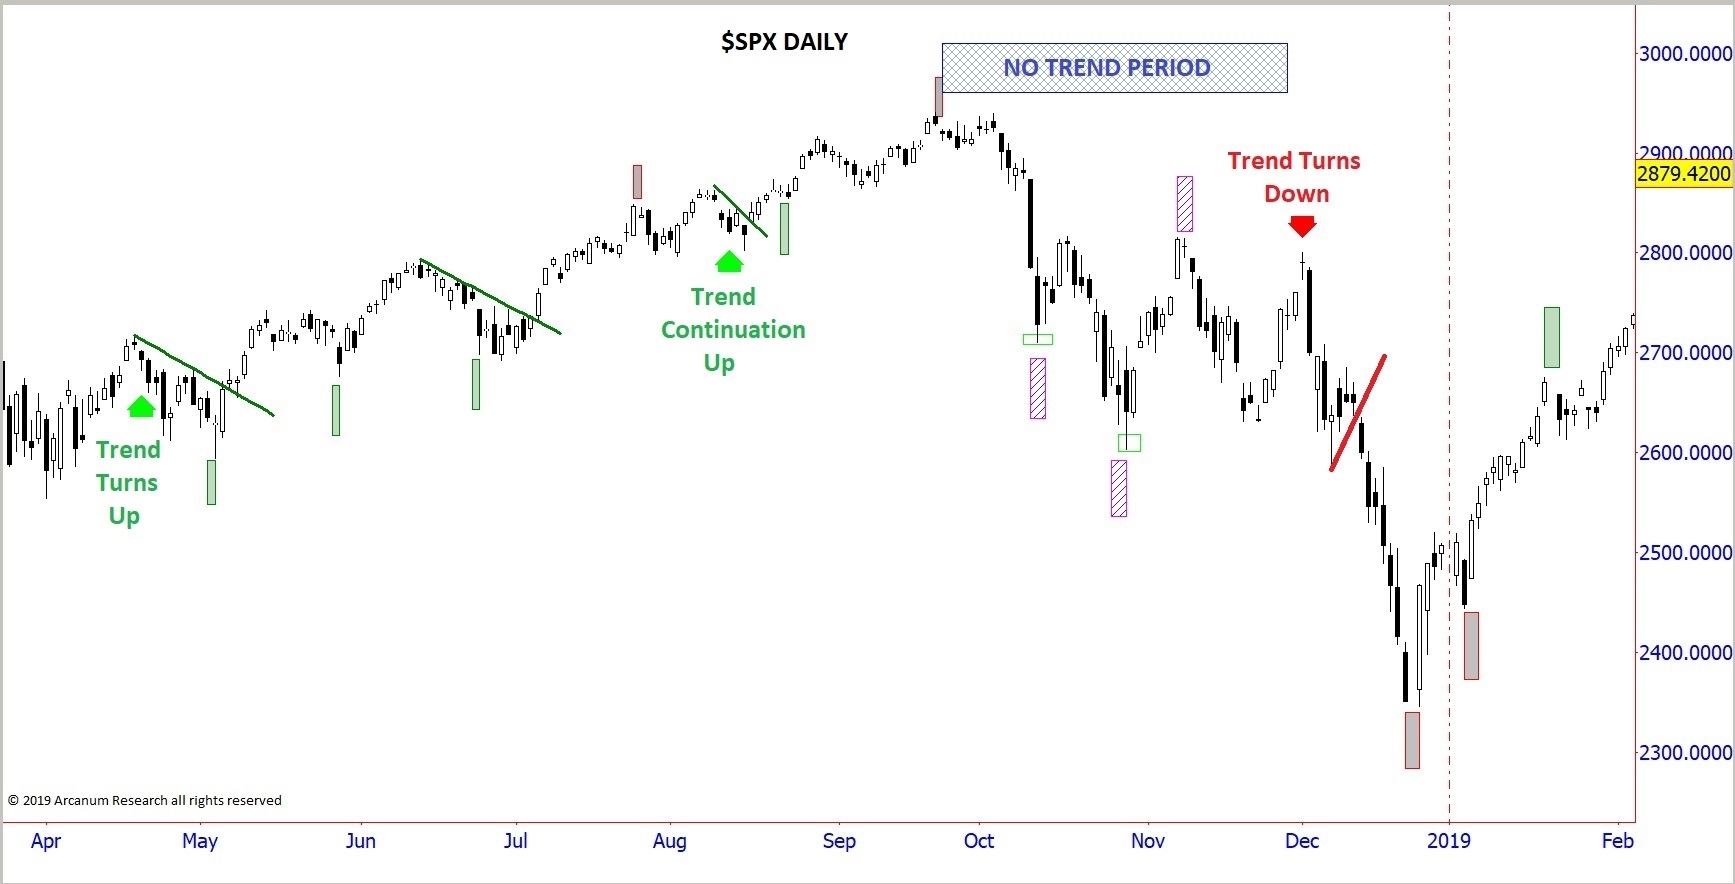
See below for actual $SPX for the year. We have removed the forecast line and added the actual trades, minor Arcana entry points resuming the trend, and some basic technical analysis.
In the above charts, the forecast line is out of the picture so you get a clear vision of what is happening. Included are the “Minor Arcana” turn times, which are entry points on moves against the trend (pale green pillars.) The red/gray pillars are Minor Arcana ends of runs in the direction of the trend, good for taking positions off the table. The light green boxes (2 of them) in October are the extreme price buy entries W. D. Gann’s Law of Vibration project.
This year presented 4 trades and 1 short entry signal in December we chose to omit from trading. Enormous volatility here. In the first trade, “A” in April, the Arcana trend forecast turns up in conjunction with the forecast curve. An aggressive at the green pillar looks good, or conservatively waiting for the market to break above the downtrend line seems safer. In trade “B,” the same choice presents between aggressive Minor Arcana entry and trendline break.
Then on September 23rd the trend stops. After 2 great trades like that, we advise “out all positions” during trend voids. “Red Alert” out at October 3rd with a red/gray top of run turn time and our “Top & Bottom Finder” signaling a definite top.
In the "trend void" between September 23rd and December 2nd, we will look for polarity line breakouts or breakdowns. The polarity lines actually flash a “too volatile” signal here during this entire time. But on October 11th a Law of Vibration price projection from the top signal and “extreme buy price” in the first light green box at 2712 sets up. This is to be our 3rd trade long with a 100+ point gain. Then another extreme price is hit at 2612. Our fourth trade. Again another 100+ point bounce.
Finally, the forecast for a December 2nd Arcana down-turn was dead on. The market takes off south, pausing and pulling back, then resumes down. Entry signals on a simple trendline break by the red trendline being broken. Even though this looks like a killer trade, we advise against it because of excessive volatility. After 4 great trades and 400+ points if these signals, why risk? After all, prices were still above an up-sloping 50-month moving average.
Email us at empire@tradingqwdgann.com or call 312-532-2116 to signal your interest in Empire.
VIEW OUTLINE & SCHEDULE. "Master The Markets" includes:

