W. D. GANN'S ARCANA TREND FORECASTING
The 'Arcana' trend forecasting mechanism is the crown jewel of legendary trader W. D. Gann. Gann found the Arcana so important that it was the subject of his first book, 'Truth of The Stock Tape.' The Arcana forecasts the direction and exact duration of each trend.
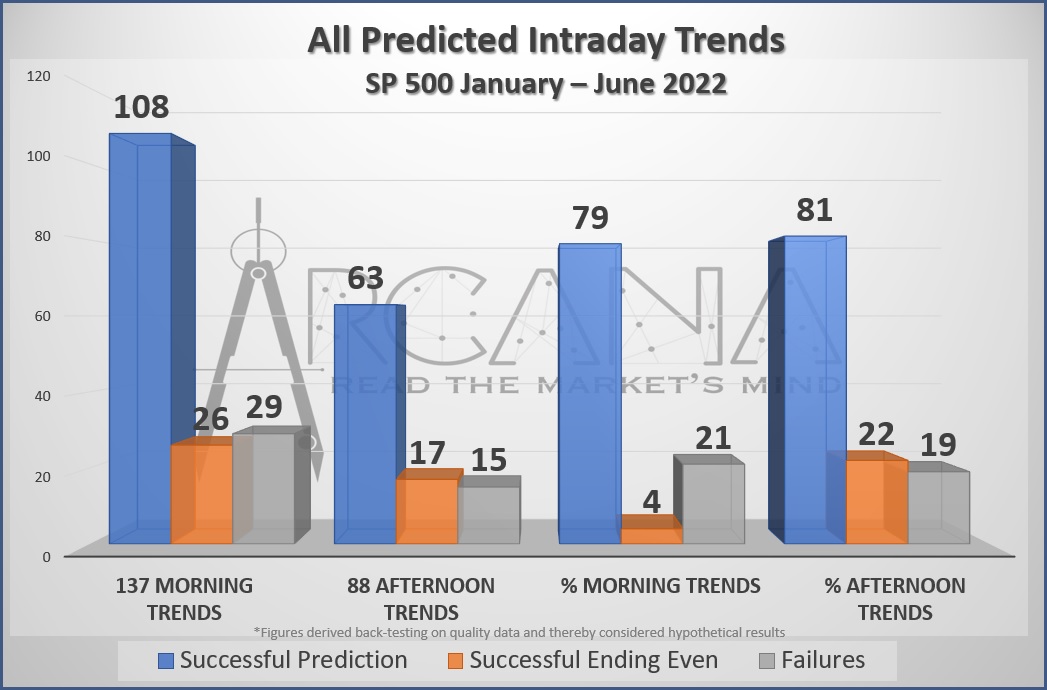
In intraday market activity, the Arcana also predicts sudden flips in the trend to the minute. Gann also discovered an entry method in the Arcana, as it pinpoints entries that coincide with the ends of moves against the trends (pullbacks or throwbacks.) Click to expand the graph to the left to see the Arcana's accuracy in predicting intraday trends.
W. D. Gann used the Arcana as the backbone of his trading plan, as his rule #1 was "Never buck the trend." Gann was talking about this Arcana predicted trend, instead of the visible, established trend. The Arcana served as the primary long/short-only filter for trades during most time periods.

The Arcana tracks and measures the factors Gann found to influence mass psychology behind buying and selling in the markets. This is why Gann refers to it in his book, "The Tunnel Thru The Air" as a 'mind reading machine.' If you are one of those who have spent years following and trying to understand W. D. Gann, it may help to know that Gann intended his cycles and all other techniques to be acted on against the backdrop of the Arcana trend. Without it, you simply will be unable to understand Gann's system or trade like him.
Gann never meant the Arcana to be a trading system unto itself, or to be used as a "buy and hold." Instead, the predicted Arcana direction was to be viewed as "the wind at your back." Nevertheless, as market professionals we must devise some means to statistically evaluate its effectiveness on its own. For testing purposes only, we insist the price bar at the end of the predicted trend must be higher or even than the price bar at the beginning for "UP Trends," and the opposite for down trends.
In the expandable daily chart of the SP 500 below, the Major Trend forecasts are shown by the large green and red arrows, and the text showing trend up or down. These charts were included in our Empire Market Letter published in March of each year, predicting a year forward. These Major Trend change times are precise, and were dead on. More on trading the forecast below...

The pale green turn markers are the Minor Arcana turn times. Gann states that the market frequently makes moves against the trend, and that the ends of these runs can be identified and traded by the Minor Arcana.
The red and gray markers are also Minor Arcana turn times, but they mark the end of trend runs- great for times targets to exit positions. The purple markers are also Minor Arcana turn times, but occur during a no-trend period (marked by blue box on top of chart.) These mark the tradeable ends of sharp runs in a period of chop.
The green and red trend lines illustrate some basic technical analysis that we want to mix in, included as the entries in our market letter. In periods of up-trend, one may aggressively enter on a Minor Arcana turn time or wait for a trend line break.
82 YEARS OF ARCANA: 84%
Contact us for to see our back-testing log detailing the last 82 years (220 consecutive trend leg occurrences) of each trend leg of the Annual Arcana with consistent, objective rules predicting the direction and duration of each trend leg. The unfiltered result: 84% cumulative for all 80 years; 89% for the last 40 years.
On the Intra-Week Arcana, the above back-testing is pictorially displayed on via power point file going back to 2016. 84% seems average for each year.
22 YEARS OF GOLD: 86%
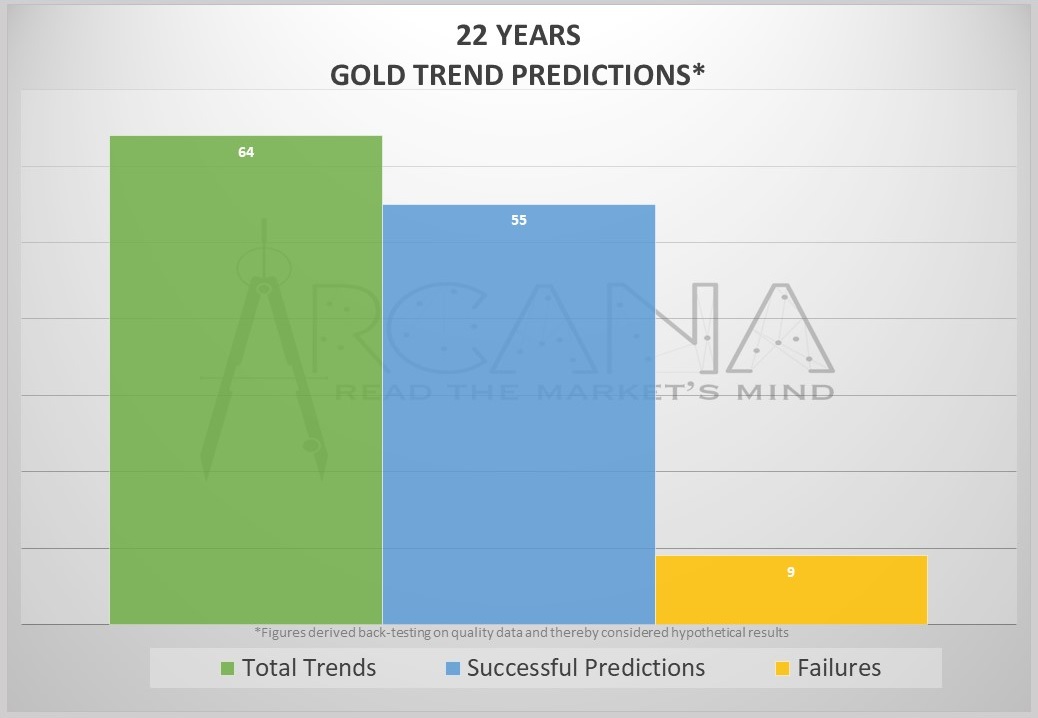
See below for the Yearly Arcana predicting the trend direction and duration for the last 22 years, including minor entry and exit times. The major trend directions and times are 86% effective.
Why 22 years? In late 2001 changes were consolidated determining the CME/COMEX merger and New York came to control the price presentation for electronic trading around the world. This created a change that can be tracked from that time. So until any of those factors change, we anticipate this Arcana continuing to do its job.

23 YEARS OF EURO: 81%
We've decided to get a bit bold here and post the entire last 23 years of the Arcana on the entire annual history of the Euro (spot forex.) Don't worry- you won't be able to reverse engineer it:) On the Euro's entire history, the Arcana accurately predicted both the direction and the duration of the 68 trend leg signals 81% of the time. And many of the trend legs deemed "failures" significantly moved in the predicted direction for most of the trend time.
Also, we included the occurrences of the "Top & Bottom Finder" from 'Truth Of The Stock Tape.' This was Gann's technique for predicting top and bottom times within trends and time periods. You can scroll through and expand each year in the gallery below...
