W. D. GANN SQUARE METHODS
W. D. Gann used the geometrical concepts of the 'square' as a basic building block to define the vibration of each market. Each 'square' goes on to the generate numbers for most of Gann's more complex techniques.
W. D. Gann brought us 3 types of squares to use to corner market activity: Permanent Squares, Master Squares, and Magic Squares. A 'Permanent Square' is proprietary to each stock or market, and remains constant through that market's life. 'Master Squares' run through many markets, and are built from natural cycles. Below we demonstrate techniques from the Permanent Square.
All of these squares and the market techniques that flow from them are taught in our "W. D. GANN: MASTER THE MARKETS" Training. We are unable to show the breakdown of the calculation here, or how that numerological foundation is used. But we can show the results of the trading and analysis techniques that use the square for their foundation.
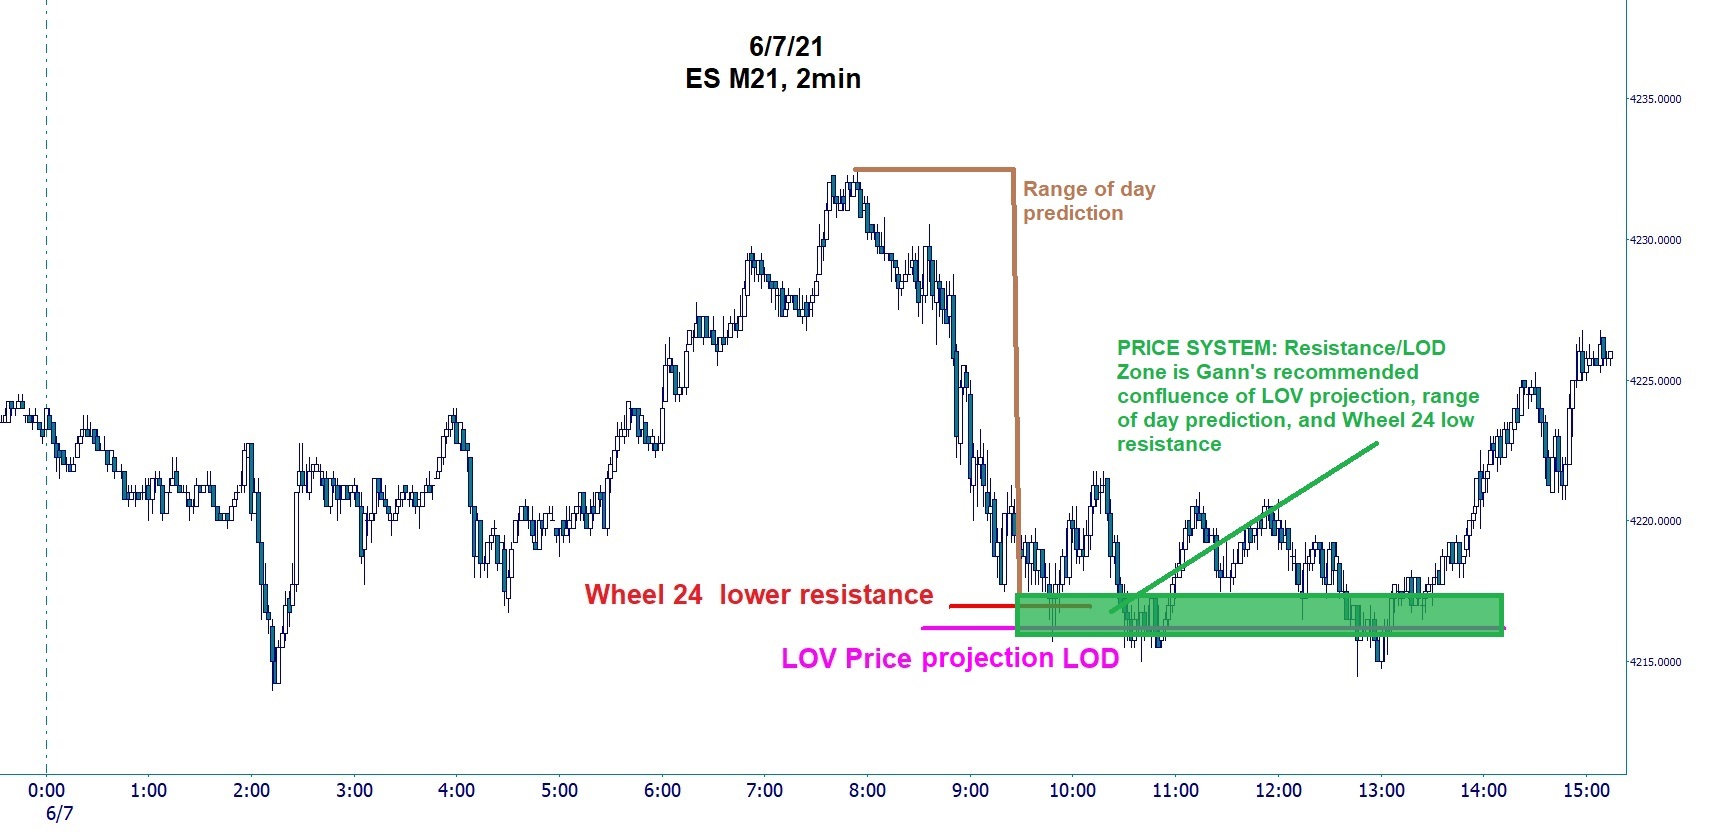
First, lets start with the most practical in expandable gallery above. Price range prediction from a top to bottom, or bottom to top is a product of 'the square.' Gann calls this 'squaring' the price, time, or range.
In "How To Make Profits On Commodities," Gann tells us that once we calculate the range prediction, watch for the 50%, 100%, 150%, 200% exact increments of range for the exact highs and lows. He uses plural, meaning these levels must be combined with other Gann techniques like Wheel 24 and LOV to confluence exact price. Remember, Gann would combine this technique with exact predictions of bottom and top times, as well as other price projections from the Law of Vibration.
Note, for example, while a bottom price can be predicted on a certain day, the price can cannonball upward in the New York session and never 'activate' that predicted bottom price (in these cases a top price will be activated.') Also, Gann added time (not shown on this page,) in addition to market activity, as an additional activation of the price.
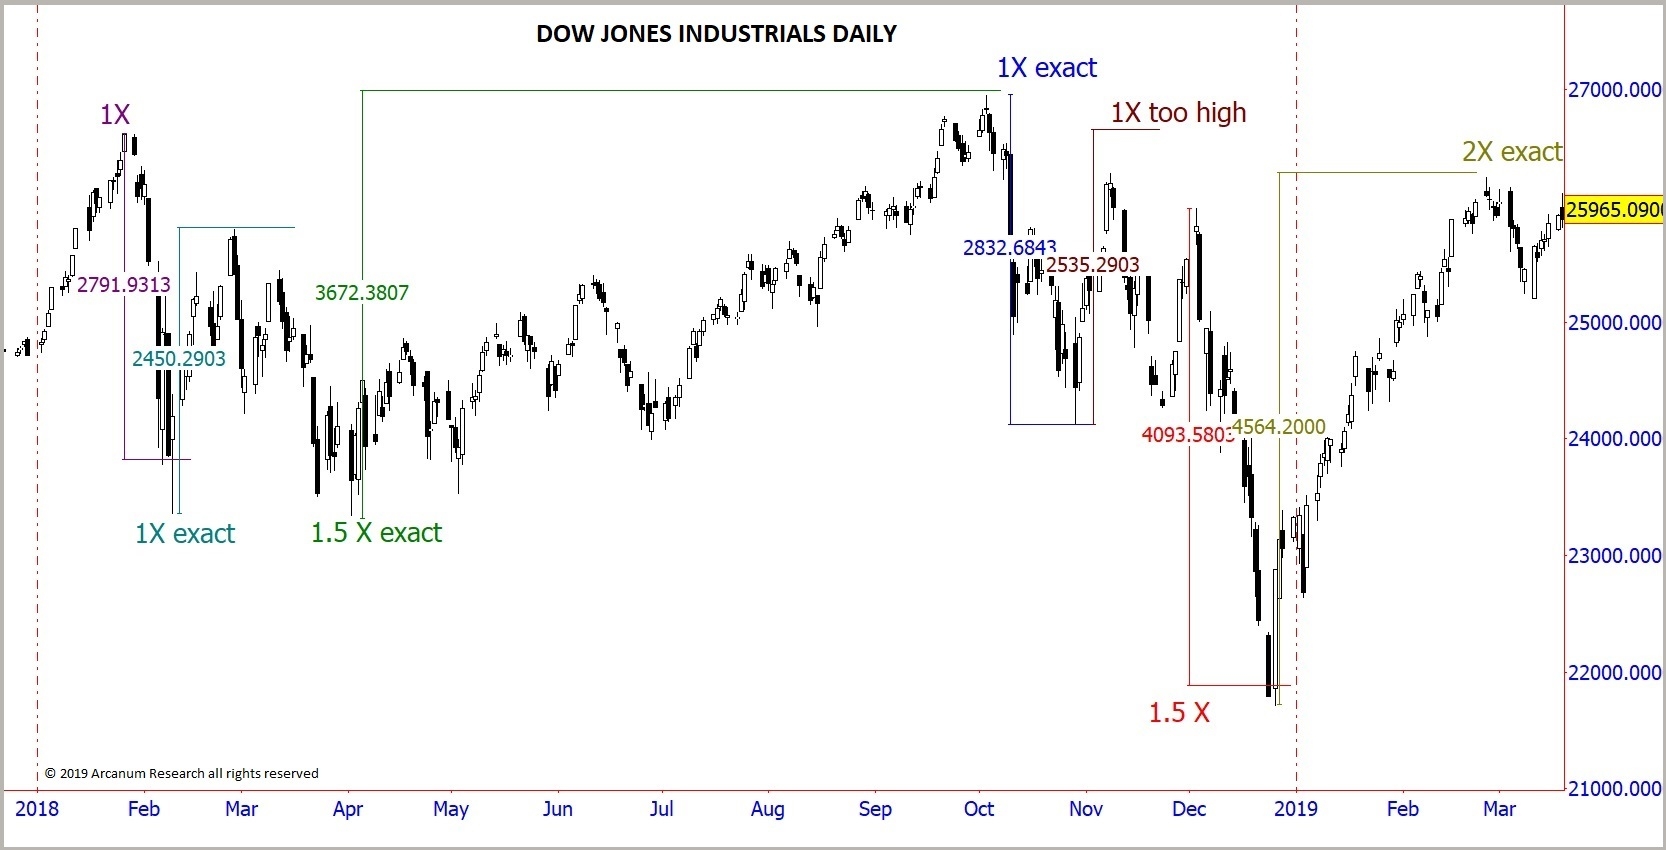
The expandable daily chart of the Dow Jones Industrials below illustrates the range PREDICTIONS from squaring out price, using tops to bottoms and from bottoms to tops. The actual data in the chart below for accuracy. Numbers of the same color at the base or end of each prediction- either 1X, 1.5X, and 2X- denote 100%, 150%, and 200% of the predicted range.
This technique works well in all timeframes, and is equally accurate. The trick is that for the daily charts, it works on the Dow Jones industrials, and for intraday, it works on the ES futures.


